ΔΝΣΤΠΟ ΤΠΟΒΟΛΗ ΣΔΛΙΚΗ ΔΚΘΔΗ ΠΡΟΟΓΟΤ ΔΡΔΤΝΗΣΙΚΟΤ ΔΡΓΟΤ ΣΗ ΓΔΜΗ FINAL PROGRESS REPORT FORM FOR RESEARCH PROJECTS FUNDED BY DESMI
|
|
|
- Ευθαλία Μαυρογένης
- 6 χρόνια πριν
- Προβολές:
Transcript

1 ΚΤΠΡΙΑΚΗ ΔΗΜΟΚΡΑΣΙΑ ΕΤΡΩΠΑΙΚΗ ΕΝΩΗ Η ΔΕΜΗ ΤΓΥΡΗΜΑΣΟΔΟΣΕΙΣΑΙ ΑΠΟ ΣΗΝ ΚΤΠΡΙΑΚΗ ΔΗΜΟΚΡΑΣΙΑ ΚΑΙ ΣΟ ΕΤΡΩΠΑΪΚΟ ΣΑΜΕΙΟ ΠΕΡΙΦΕΡΕΙΑΚΗ ΑΝΑΠΣΤΞΗ ΣΗ ΕΕ DESMI IS CO-FUNDED BY THE REPUBLIC OF CYPRUS AND THE EUROPEAN REGIONAL DEVELOPMENT FUND OF THE EU ΔΝΣΤΠΟ ΤΠΟΒΟΛΗ ΣΔΛΙΚΗ ΔΚΘΔΗ ΠΡΟΟΓΟΤ ΔΡΔΤΝΗΣΙΚΟΤ ΔΡΓΟΤ ΣΗ ΓΔΜΗ FINAL PROGRESS REPORT FORM FOR RESEARCH PROJECTS FUNDED BY DESMI ΣΙΣΛΟ ΔΡΓΟΤ PROJECT TITLE ΑΝΑΓΟΥΟ ΦΟΡΔΑ HOST ORGANISATION ΤΝΣΟΝΙΣΗ ΔΡΓΟΤ PROJECT COORDINATOR Integrated High Resolution System for Monitoring and Quantifying the Wave Energy Potential in the EEZ of Cyprus (Ewave) Oceanography Center, University of Cyprus Dr. George Zodiatis 1
2 ΟΓΗΓΙΔ ΤΠΟΒΟΛΗ ΣΔΛΙΚΗ ΔΚΘΔΗ ΠΡΟΟΓΟΤ / FINAL REPORT SUBMISSION GUIDELINES Η Σελική Έκθεζη ςποβάλλεηαι ζε ηλεκηπονική και ένηςπη μοπθή (ζε δύο δεμένα ανηίγπαθα), ηο απγόηεπο δύο μήνερ μεηά ηην ημεπομηνία λήξηρ ηος Έπγος. Η Σελική Έκθεζη πεπιλαμβάνει ηπία μέπη: The Final Report is submitted in electronic and print format (in two bound copies), within two months of the Project s completion date, at the latest. The Final Report comprises of the following three parts: ΜΔΡΟ Α / PART A - Σελική Έκθεζη Πποόδος / Final Progress Report Α.1. Γενικά ηοισεία Έπγος / General Project Information Α.2. Πεπίλητη / Abstract Α.3. Σελική Έκθεζη Τλοποίηζηρ Έπγος / Final Project Implementation Report Α.4. Πίνακαρ Γεζμών Δπγαζίαρ / Work Packages Table ΜΔΡΟ Β / PART B Παπαπηήμαηα / Annexes Β.1. Παπάπηημα Β1 - Παπαδοηέα ηος Έπγος / Annex B1 Project Deliverables Β.2. Παπάπηημα Β2 - Άλλερ Πληποθοπίερ / Annex B2 - Other Information ΜΔΡΟ Γ / PART C - Σελική Έκθεζη Οικονομικών Πεππαγμένυν / Final Financial Report Η Σελική Έκθεζη Οικονομικών Πεππαγμένυν ςποβάλλεηαι ζε ξεσυπιζηό ειδικό ένηςπο πος είναι διαθέζιμο ζηον ιζηοσώπο ηος Ιδπύμαηορ Πποώθηζηρ Έπεςναρ ζε μοπθή απσείος Excel. The Final Financial Report is submitted in a separate form in excel format available on the Research Promotion Foundation s website. 2
3 Μ Δ Ρ Ο Α / P A R T A Α.1. ΓΔΝΙΚΑ ΣΟΙΥΔΙΑ ΔΡΓΟΤ / GENERAL PROJECT INFORMATION Δπισειπηζιακό Ππόγπαμμα Operational Programme Άξοναρ Πποηεπαιόηηηαρ Priority Axis Ππόγπαμμα Programme Γπάζη Action Απιθμόρ Ππυηοκόλλος Έπγος Project Protocol Number Σίηλορ Έπγος Project Title Ανάδοσορ Φοπέαρ Host Organisation ςνηονιζηήρ Έπγος Project Coordinator Ημεπομηνία Έναπξηρ Έπγος Project Starting Date Ημεπομηνία Λήξηρ Έπγος Project Completion Date Ημεπομηνία Τποβολήρ Έκθεζηρ Report Submission Date Δγκεκπιμένη Δπισοπήγηζη Approved Funding Ποζό πος καηαβλήθηκε από ηο ΙΠΔ (μέσπι ζηιγμήρ) Funding Received from RPF (so far) Ποζό πος δαπανήθηκε (μέσπι ζηιγμήρ) Actual Expenses Incurred (so far) Αειθόπορ Ανάπηςξη και Ανηαγυνιζηικόηηηα Sustainable Development and Competitiveness Κοινυνία ηηρ Γνώζηρ και Καινοηομία Knowledge Society and Innovation TECHNOLOGY ENERGY ΣΔΧΝΟΛΟΓΙΑ/ΔΝΔΡΓ/0609(ΒΙΔ)/01 Integrated High Resolution System for Monitoring and Quantifying the Wave Energy Potential in the EEZ of Cyprus Oceanography Center, University of Cyprus Dr. George Zodiatis 03/01/ /05/ /07/ ΕΥΡΩ / EUR ΔΤΡΧ / EUR ΕΥΡΩ / EUR 3
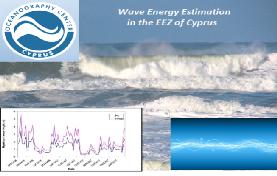
4 ηοισεία Δπικοινυνίαρ ςνηονιζηή Έπγος / Project Coordinator s Contact Information Γιεύθςνζη Address Σηλέθυνα Telephone No. Σηλεομοιόηςπο Fax No. Ηλεκηπονικό ηασςδπομείο address Oceanography Center, University of Cyprus, Nicosia 1678, Cyprus (00357) , (00357) (00357) gzodiac@ucy.ac.cy Α.2. ΠΔΡΙΛΗΦΗ (μέσπι 500 λέξειρ ζε κάθε γλώζζα) / ABSTRACT (up to 500 words in each language) The Integrated High Resolution System for Monitoring and Quantifying the Wave Energy Potential in the Exclusive Economical Zone (EEZ) of Cyprus (Ewave) project brought together leading Universities and Technological Centers in Europe and the United States which, in a framework of productive collaboration, developed novel systems and methodologies for monitoring and forecasting the wave energy potential in the Eastern Mediterranean focusing, particularly, to the Exclusive Economic Zone of Cyprus. State of the art physical models able to accurately simulate the wind/wave characteristics over the area of interest utilized in conjunction with advanced mathematical-statistical techniques for the optimization of the results towards an integrated system for wave power prediction. The analysis covered a time period of 10 years ( ) at a very high spatial resolution (1/60 degrees) which, to the partners knowledge, is the finer adopted for the area until now. The final outputs-results of the project include: High resolution digital atlases depicting the main sea wave and wind climatological characteristics over the area of interest as well as detailed maps for the distribution of the wave energy potential over the coastal and offshore areas of the EEZ of Cyprus. In this way the areas of Levantine, and in particular those of Cyprus sea areas, that are advantageous for developing wave power production platforms have been revealed. As the results of the project prove, the wave energy potential west and south of Cyprus 4
5 is, in general, relatively low and stable and hence exploitable. However, non-trivial impact of infrequent values is also recorded. Advanced statistical techniques developed for the prediction and quantification of wave energy in short and long forecasts. An operational system for the every-day forecasting of the available wave energy potential in the eastern Mediterranean area. A state of the art visualization and analysis system for the results of the project has been set up and is available online. A number of publications in peer reviewed scientific journals and conference proceedings in which the results of the project have been presented. An international workshop was organized in Cyprus during which the latest advances in the field of wave energy as well as the potential applications have been discussed by a number of scientists coming from different countries and research centers as well as from local governmental organizations and potential end users. Moreover, new avenues for future cooperation between the Oceanography Center of the University of Cyprus (the host institute of the project) with other research groups and operational centers in Europe and the United states have been created in an area of high research interest with critical applications in the general social-economic activities, that of renewable energy monitoring and forecasting. It should be noted that the above mentioned activities, which not only fulfill but overcome the initially set targets of the project, have been successfully taken despite the significant difficulties created to the partners by the delay in the second and third payment by the funding Institute. Το πρόγραμμα «Ζνα Ολοκλθρωμζνο Σφςτθμα Υψθλισ Διακριτικισ Ικανότθτασ για τον Προςδιοριςμό του Θαλάςςιου Ενεργειακοφ Δυναμικοφ ςτθν ΑΟΗ τθσ Κφπρου" (EWAVE) ςυγκζντρωςε κορυφαίεσ ερευνθτικζσ ομάδεσ πανεπιςτθμίων και τεχνολογικϊνεπιχειρθςιακϊν κζντρων ςτθν Ευρϊπθ και τισ Θνωμζνεσ Πολιτείεσ τθσ Αμερικισ οι οποίεσ, ςτα πλαίςια μιασ ιδιαίτερα παραγωγικισ ςυνεργαςίασ, ανζπτυξαν νζα ςυςτιματα και μεκοδολογίεσ για τθν παρακολοφκθςθ και πρόβλεψθ τθσ διακζςιμθσ κυματικισ ενζργειασ 5
6 ςτθν Ανατολικι Μεςόγειο, με επίκεντρο, τθν Αποκλειςτικι Οικονομικι Ηϊνθ τθσ Κφπρου. Τελευταίασ γενιάσ φυςικά-μακθματικά μοντζλα με δυνατότθτεσ υψθλισ ακρίβειασ προςομοιϊςεων των χαρακτθριςτικϊν του ανζμου και των καλαςςίων κυμάτων ςτθν περιοχι ενδιαφζροντοσ χρθςιμοποιικθκαν ςε ςυνδυαςμό με προθγμζνεσ ςτατιςτικζσ τεχνικζσ για τθ βελτιςτοποίθςθ των αποτελεςμάτων τουσ, δθμιουργϊντασ ζνα ολοκλθρωμζνο ςυςτιματοσ για τθν παρακολοφκθςθ/πρόγνωςθ τθσ διακζςιμθσ κυματικισ ενζργειασ. Θ ανάλυςθ που πραγματοποιικθκε κάλυψε ζνα χρονικό διάςτθμα 10 ετϊν ( ), ςε πολφ υψθλι χωρικι ανάλυςθ (1/60 μοίρεσ), τθν μεγαλφτερθ που ζχει χρθςιμοποιθκεί μζχρι ςιμερα ςτθν περιοχι. Τα τελικά αποτελζςματα του ζργου περιλαμβάνουν: Yψθλισ ανάλυςθσ ψθφιακοφσ άτλαντεσ που απεικονίηουν τα κφρια κλιματικά χαρακτθριςτικά του καλάςςιου κυματιςμοφ και του ανζμου ςτθν περιοχι ενδιαφζροντοσ, κακϊσ και λεπτομερείσ χάρτεσ για τθν κατανομι τθσ ενζργειασ που μπορεί να παραχκεί από τον καλάςςιο κυματιςμό ςτισ παράκτιεσ και υπεράκτιεσ περιοχζσ τθσ ΑΟΗ τθσ Κφπρου αλλά και τθσ ευρφτερθσ περιοχισ τθσ Λεβαντίνθσ, αναδεικνφοντασ τισ καλάςςιεσ περιοχζσ, που προςφζρονται για τθν ανάπτυξθ εγκαταςτάςεων παραγωγισ κυματικισ ενζργειασ. Όπωσ προκφπτει από τθν παραπάνω ανάλυςθ οι δυτικζσ και νότιεσ καλάςςιεσ περιοχζσ τθσ Κφπρου παρουςιάηουν ιδιαίτερο ενδιαφζρον. Το διακζςιμο ενεργειακό δυναμικό ςε αυτζσ, αν και χαμθλότερο από αυτό που εμφανίηεται ςτισ ακτζσ τθσ Βόρειασ Ευρϊπθσ, είναι ςτακερό και εκμεταλλεφςιμο. Καταγράφεται επίςθσ μία μθ τετριμμζνθ ςυνειςφορά ακραίων τιμϊν. Νζεσ ςτατιςτικζσ τεχνικζσ αναπτφχκθκαν για τθν πρόβλεψθ και τθν ποςοτικοποίθςθ τθσ ενζργειασ των κυμάτων ςε βραχυπρόκεςμουσ και μακροπρόκεςμουσ χρονικοφσ ορίηοντεσ πρόβλεψθσ. Δθμιουργικθκε ζνα επιχειρθςιακό ςφςτθμα για τθν κακθμερινι πρόβλεψθ του διακζςιμου δυναμικοφ κυματικισ ενζργειασ ςτθν περιοχι τθσ ανατολικισ Μεςογείου. Ζνα δυναμικό και φιλικό προσ τον χριςτθ ςφςτθμα οπτικοποίθςθσ και ςτατιςτικισ ανάλυςθσ για τα αποτελζςματα του ζργου ζχει δθμιουργθκεί και είναι διακζςιμο ςτο διαδίκτυο. Τα αποτελζςματα και οι δραςτθριότθτεσ που αναπτφχκθκαν ςτα πλαίςια του Ewave δθμοςιεφτθκαν ςε ζγκριτα διεκνι επιςτθμονικά περιοδικά και πρακτικά ςυνεδρίων. 6
7 Μια διεκνισ θμερίδασ διοργανϊκθκε ςτθν Κφπρο ςτα πλαίςια τθσ οποίασ ςυηθτικθκαν οι τελευταίεσ εξελίξεισ ςτον τομζα τθσ κυματικισ ενζργειασ κακϊσ και οι πικανζσ εφαρμογζσ τθσ. Στθν θμερίδα ςυμμετείχαν επιςτιμονεσ από πολλζσ Ευρωπαϊκζσ χϊρεσ και ερευνθτικά κζντρα κακϊσ και μζλθ/εκπρόςωποι τοπικϊν κυβερνθτικϊν οργανϊςεων και ενδιαφερόμενων φορζων. Θ εξαιρετικι ςυνεργαςία που αναπτφχκθκε μεταξφ των εταίρων του ζργου ανοίγει νζεσ δυνατότθτεσ για τθ μελλοντικι ςυνεργαςία μεταξφ του Ωκεανογραφικοφ Κζντρου του Πανεπιςτθμίου Κφπρου (φορζασ υποδοχισ του ζργου) με άλλεσ ερευνθτικζσ ομάδεσ και με επιχειρθςιακά κζντρα ςτθν Ευρϊπθ και τισ Θνωμζνεσ Πολιτείεσ ςε μια ερευνθτικι περιοχι υψθλοφ ενδιαφζροντοσ με κρίςιμεσ εφαρμογζσ ςε ευρφτερεσ κοινωνικό-οικονομικζσ δραςτθριότθτεσ. Θα πρζπει να ςθμειωκεί ότι οι παραπάνω δραςτθριότθτεσ, οι οποίεσ ξεπζραςαν τουσ αρχικοφσ ςτόχουσ του ζργου και τισ προςδοκίεσ των εμπλεκομζνων μερϊν, επιτεφχκθκαν παρά τισ ςθμαντικζσ δυςκολίεσ που δθμιουργικθκαν ςτουσ εταίρουσ από τθ ςθμαντικι κακυςτζρθςθ μζχρι και ςιμερα τθσ χρθματοδότθςθσ του ζργου. 7
8 Α.3. ΤΛΟΠΟΙΗΗ ΔΡΓΟΤ (μέσπι 1500 λέξειρ ανά ΓΔ) / PROJECT IMPLEMENTATION (up to 1500 words per WP) Σίηλορ Γέζμηρ Δπγαζίαρ Work Package Title Κυδικόρ Φοπέα Partner Code Ανθπυπομήνερ για κάθε Φοπέα (με βάζη ηο ςμβόλαιο) Personmonths per Partner (according to the Contract) Γεδοςλεςμένοι Ανθπυπομήνερ για κάθε Φοπέα Personmonths Worked per Partner ΓΔ1: Γιασείπιζη Έπγος WP1: Project Management ΑΦ / HO ΣΦ1 / PA1 ΣΦ2 / PA2 ΣΦ3 / PA3 ΣΦ4 / PA ηόσοι Γέζμηρ Δπγαζίαρ (όπυρ πεπιγπάθονηαι ζηο Παπάπηημα Ι ηος ςμβολαίος) Work Package Objectives (as described in Annex I of the Contract) Αναθέπονηαι επιγπαμμαηικά οι ζηόσοι ηηρ παπούζαρ Γέζμηρ Δπγαζίαρ. Briefly describe the objectives of this Work Package. Project coordination Monitoring the overall performance of the project Assess conformity of the results with the initial project scope and goals Administer project resources and monitor project spending Organizing and monitoring group or subgroup meetings. Πεπιγπαθή Δπγαζίαρ Work Description The project was coordinated by the Oceanography Center of the University of Cyprus (OC-UCY) that closely monitored the work process in all the working packages. To this end a number of meetings and teleconferences have been organized between the partners of the project: Atmospheric Modeling and Weather Forecasting Group, Department of Physics, University of Athens, Greece (AM&WFG-UOA), Naval Ocean Analysis Laboratory, Naval Postgraduate School, USA (NOAP-NPS), Cyprus Energy Agency (CEA), Meteorological Service of Cyprus (Met-CY). Moreover, a web page has been set up by the OC-UCY ( dedicated to the project s activities, which apart from the presentation of the results of the project, supported the online monitoring of the activities of the partners through the public and the internal domain created. The main problem concerning the coordination of the project is connected with the serious delay in the funding by the RPF a fact that affected the activities of the partners. For this reason and in order to give to all the research groups supporting the project the time to complete their obligations, the Host 8
9 Institute (Oceanography Center of the University of Cyprus) claimed an extension of the project (Appendix 1). The extension has been approved by RPF (Appendix 2) and the new date of project s completion was defined to the 2nd of May, This extension has not affected the project s budget. Despite these difficulties and based on the excellent cooperation between the Host Institute and the other partners of the project, all the goals of the project have been achieved. Concerning the researchers working for the Ewave project the following changes have been taken place: The Atmospheric Modeling and Weather Forecasting Group of the University of Athens, Greece, added a new researcher, Dr. Athanasiadis, in the research group in order to speed up the work and to guarantee the smooth continuation of the project since one of the main members of the group (Dr. Mitsakou) left the (AM&WFG-UOA) on October It should be noted that the budget of the UOA group remained unchanged. The Cyprus Energy Agency had replaced one of the researcher, Mr. Savvas Vlachos with Mr. Orestis Kyriacou since the beginning of the project. Mr. Orestis Kyriacou was recruited after the submission of the project proposal and was evaluated as suitable to meet the needs of this project, taking into account his academic qualifications. It should be noted that the budget of the CEA group remained unchanged. Παπαδοηέα Deliverables D1 Six-monthly Periodic Progress Reports four six monthly periodic progress reports have been delivered to RPF D2 Intermediate report and reports for the monitoring group meetings The intermediate report has been delivered on time to RPF. Reports for the coordination of the partners and the group meetings that have been organized were included in the six monthly periodic reports of the project. D3 Final report 9
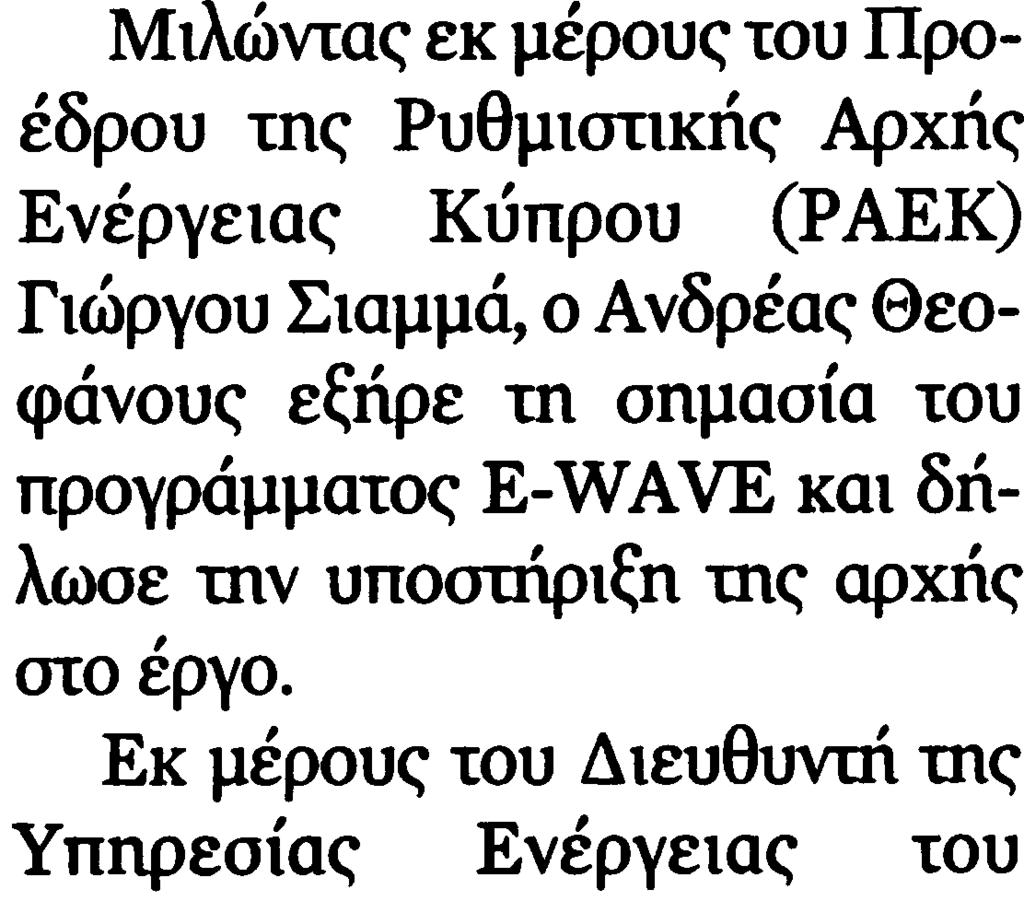
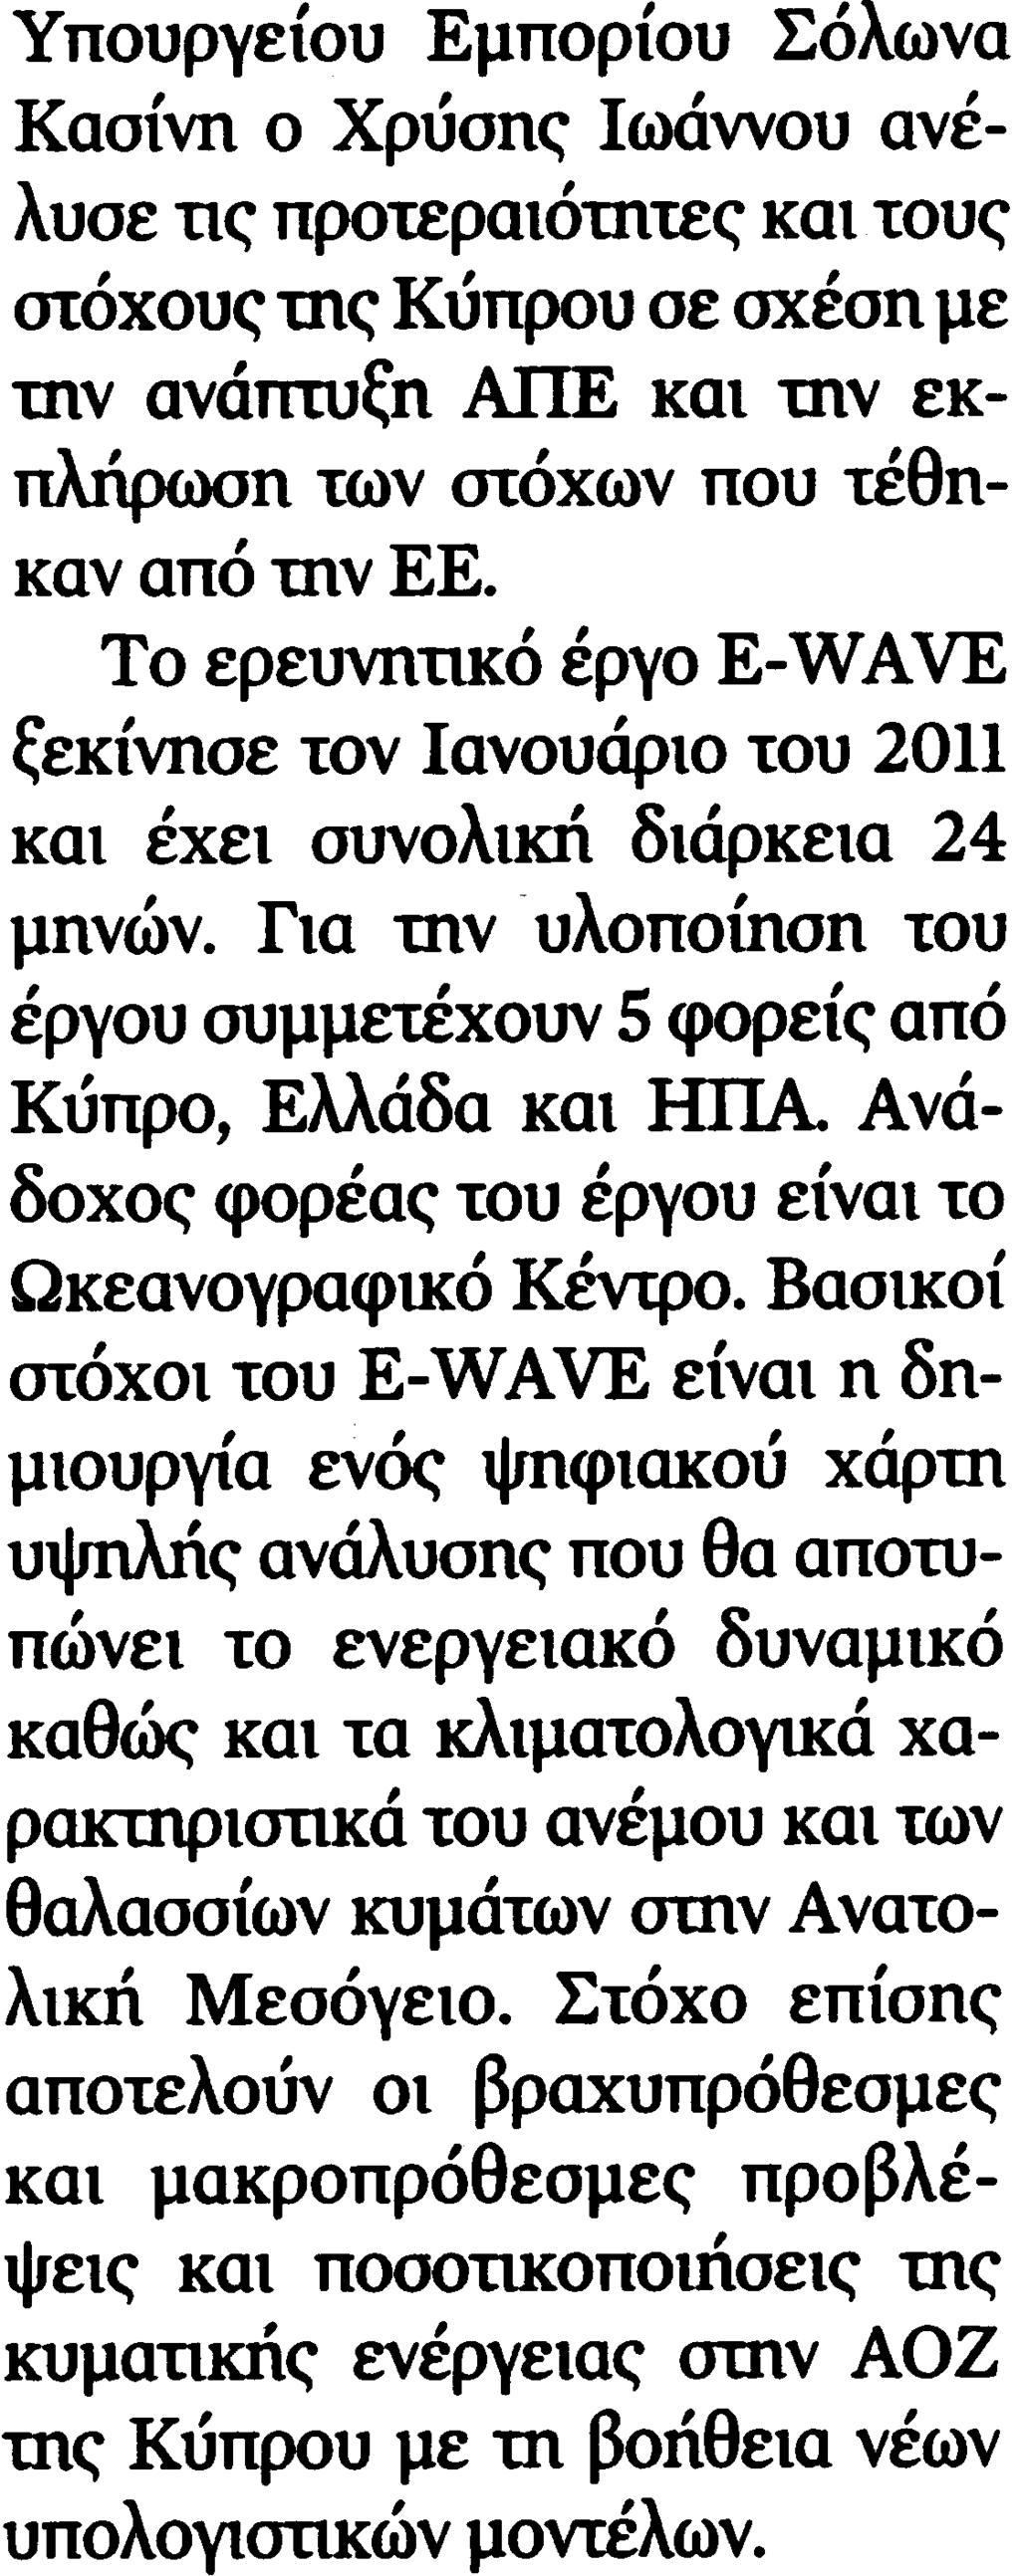
10 Σίηλορ Γέζμηρ Δπγαζίαρ Work Package Title Κυδικόρ Φοπέα Partner Code Ανθπυπομήνερ για κάθε Φοπέα (με βάζη ηο ςμβόλαιο) Personmonths per Partner (according to the Contract) Γεδοςλεςμένοι Ανθπυπομήνερ για κάθε Φοπέα Personmonths Worked per Partner ΓΔ2: Γιάσςζη & Δκμεηάλλεςζη Αποηελεζμάηυν WP2: Dissemination and Exploitation of Results ΑΦ / HO ΣΦ1 / PA1 ΣΦ2 / PA2 ΣΦ3 / PA3 ΣΦ4 / PA ηόσοι Γέζμηρ Δπγαζίαρ (όπυρ πεπιγπάθονηαι ζηο Παπάπηημα Ι ηος ςμβολαίος) Work Package Objectives (as described in Annex I of the Contract) Spreading the results of the project to the local and international scientific community, end users, decision makers in the energy market and energy politics as well as to international organisations. Participation and contribution to the following external events: industry meetings, exhibitions, workshops and conferences. Cooperation with Cyprus and international organizations activated in the renewable energy framework Training the personnel of local authorities for the optimum use of the results of the project. Πεπιγπαθή Δπγαζίαρ Βαθμόρ Τλοποίηζηρ ηυν ηόσυν ηηρ Γέζμηρ Δπγαζίαρ Work Description Degree of Work Package Objectives Implementation Within the framework of WP2 the following activities have been taken: A web page has been set up by the Oceanography Center of the University of Cyprus (OC-UCY) dedicated to the Ewave project (Deliverable No. 5). Through this web page, the activities of the project were presented while the partners had the chance to monitor online the specific and overall progress of project via the internal domain that has been created. The page is available at the electronic address An international workshop under the title Wave Energy Potential in the Eastern Mediterranean Sea: Quantification and Exploitation organized by the Oceanography Center of the University of Cyprus in cooperation with the Cyprus Energy Agency on July the 9th of 2012 in Nicosia, Cyprus (see the Workshop Announcement Appendix 3). During the workshop the results of the project have been presented but also a general the recent advances in wave energy have been discussed. Scientists from different countries and research centers participated along with representatives from local governmental organizations and potential end users (see participants list Appendix 4). The presentations given are available in electronic and printed form in the 10
11 Proceedings of the workshop (Deliverable No 4, Appendix 20). The workshop and the Ewave project generally, have been given wide publicity by the local press. Several articles have been devoted to the projects activities and results (see some characteristic articles in Cyprus newspapers, Appendix 5). Furthermore, articles of the EWAVE project activities and the EWAVE workshop were published in the Cyprus Scientific and Technical Chamber bulletin which is being distributed to more than 10,000 registered engineers (Feb 2012, April 2013 Appendix 5). A novel visualization and analysis system (LAS: Live Access Server) has been set up by the Oceanography Center of the University of Cyprus (OC-UCY). This system has been developed and follows the standards of the National Oceanic and Atmospheric Administration (NOAA) USA, can be utilized for the dynamical visualization of the wind and wave predictions and to provide corresponding statistical analysis to the end users. The system can be reached online at while some sample plots are presented in Appendix 6. A seminar was organized by the US Naval Ocean Analysis and Prediction Laboratory, Naval Postgraduate School on August 2011 at Monterey, California, USA during which the scientist of the OC-UCY Dr. George Galanis presented the activities and the so far results of the E-wave project to the academic community of NPS and the local society (Appendix 7). A meeting with local authorities, organizations and end-users, has been organized on February the 1 st, 2013, at the Cyprus University by the Oceanography Center of the University of Cyprus in cooperation with the Cyprus Energy Agency. The main results of the project and potential applications have been presented to the Cyprus research and technical community targeting to trigger new actions based on the obtained knowledge. This presentation given during the meeting was distributed by mail to the participants. The participants provided their opinion on this topic which was registered in the minutes of the meeting which, along with the list of participants, can be found in Appendix 8. A leaflet of the E-wave project have been designed and printed in 2000 copies by the Cyprus Energy Agency. Moreover, the E-wave leaflet and flyer were sent electronically to more than recipients. Three E-wave newsletters have been released by the Cyprus Energy Agency (Appendix 9) in which all the activities of the project are presented. The following papers relevant to the Ewave project have been published in scientific journals and 11
12 conferences proceedings by the partners: 1. George Galanis, Peter C. Chu, George Kallos, Yu-Heng Kuo and C.T.J. Dodson, Wave Height Characteristics in the North Atlantic Ocean: a new approach based on statistical and geometrical techniques, Stoch Environ Res Risk Assess (2012) 26:83 103, DOI /s (Appendix 10). 2. George Galanis, Dan Hayes, George Zodiatis, Peter C. Chu, Yu-Heng Kuo and George Kallos, Wave height characteristics in the Mediterranean Sea by means of numerical modeling, satellite data, statistical and geometrical techniques, Marine Geophysical Research (2012) 33:1 15, DOI /s (Appendix 11). 3. Galanis G., Zodiatis G., Hayes D., Nikolaidis A., Georgiou G., Stylianou S., Kallos G., Kalogeri C., Chu P.C., Charalampous A., Savidou K., Michaelides S., The E-wave project: Estimation of wave power potential in Cyprus, 10th PanHellenic Symposium of Oceanography and Fishery, Athens 2012 (Appendix 12). 4. G. Zodiatis, G. Galanis, D. Hayes, A. Nikolaidis, C. Kalogeri, A. Adam, G. Kallos, and G. Georgiou, Near Shore Wave Modeling and applications to wave energy estimation, Geophysical Research Abstracts Vol. 14, EGU , 2012 (Appendix 13). 5. Galanis G., Zodiatis G., Hayes D., Nikolaidis A., Georgiou G., Stylianou S., Kallos G., Kalogeri C., Chu P.C., Charalambous A., Savvidou K., Michaelides S., Numerical wave modeling and wave energy estimation, COMECAP 2012, 11th International Conference on Meteorology, Climatology and Atmospheric Physics, Athens 2012 (Appendix 14). 6. G. Zodiatis, D. Hayes, A. Karaolia, S. Stylianou, A. Nikolaidis, I. Constantinou, S. Michael, G. Galanis and G. Georgiou, Technologies for Online Data Management of Oceanographic Data, Geophysical Research Abstracts, Vol. 14, EGU , 2012, EGU General Assembly 2012 (Appendix 15). 7. Zodiatis G., Galanis G., Hayes D., Nikolaidis A., Georgiou G., Stylianou S., Kallos G., Kalogeri C., Chu P.C., Charalambous A., Savvidou K., Kountouriotis Z., Michaelides S., Estimation and monitoring of the wave energy potential in Cyprus, 4th International Meeting on Meteorology and Climatology of the Mediterranean, Roussillon, France, 2013 (Appendix 16). 8. G. Zodiatis, G. Galanis. G. Emmanouil, D. Hayes, A. Nikolaidis, G. Georgiou, C. Kalogeri and G. Kallos, Estimation and Monitoring of Wind/Wave energy potential in the Eastern Mediterranean Sea, EGU General Assembly 2013 (Appendix 17). 9. George Galanis, George Zodiatis, Dan Hayes, Andreas Nikolaidis and George Kallos, CYCOFOS new wave forecasting system incorporating sea currents, European Geosciences Union, 2011 (Appendix 18). 12
13 10. G. Kallos, C. Kalogeri, A. Adam, G. Galanis and A. Liakatas, Evaluation of High Resolution Wave Simulations with SAR-Observations and Estimation of the Wave Power Potential Spatiotemporal Distribution, SEASAR 2012, The 4th International Workshop on Advances in SAR Oceanography, June 2012, Tromso, Norway (Appendix 19). 11. George Zodiatis, George Galanis, Christina Kalogeri, Andreas Nikolaidis, Dan Hayes, Georgios C. Georgiou, Peter C. Chu, and George Kallos, Wave Energy Potential in the Eastern Mediterranean Levantine Basin. An integrated 10-year study, submitted for publication (Appendix 35). The Cyprus Energy Agency (PA3) has worked a lot in the dissemination of the project exceeding the 5 man-months, as the coordinator decided that the input of CEA in the WP2 was more important and eliminated the input in the WP6. However, the overall staff cost in the approved budget remains unchanged. Παπαδοηέα Deliverables D4 Proceedings of the international workshop in which the results of the project and presentations from scientists active in energy area will be included. The proceedings of the international workshop are available in the attached CD (Appendix 20) D5 A web page presenting all the activities of the project. The web page is available online at D6 One research article published in a peer reviewed international journal. Two research articles relevant to the Ewave project have been published in scientific journals (Appendixes 10, 11) while one more has been submitted for publication (Appendix 35). D7 Five research articles presented to international conferences and published in the corresponding proceedings. Eight research articles, instead of five, relevant to the Ewave project have been presented to international conferences and published in the corresponding proceedings (Appendixes 12-19). D8 Proceedings of the meeting(s) with the local authorities-organizations-end users. The minutes of the meeting with the local authorities-organizations-end users along with the list of participants can be found in Appendix 8. 13
14 Σίηλορ Γέζμηρ Δπγαζίαρ Work Package Title Κυδικόρ Φοπέα Partner Code Ανθπυπομήνερ για κάθε Φοπέα (με βάζη ηο ςμβόλαιο) Personmonths per Partner (according to the Contact) Γεδοςλεςμένοι Ανθπυπομήνερ για κάθε Φοπέα Personmonths Worked per Partner WP3: Implementation and tuning of the wave model ΑΦ / HO ΣΦ1 / PA1 ΣΦ2 / PA2 ΣΦ3 / PA3 ΣΦ4 / PA ηόσοι Γέζμηρ Δπγαζίαρ (όπυρ πεπιγπάθονηαι ζηο Παπάπηημα Ι ηος ςμβολαίος) Work Package Objectives (as described in Annex I of the Contract) Install the wave model WAM at the super computer infrastructure of the USA Naval Postgraduate School. Fine tuning and adaptation to the local environment, coupling with the CYCOFOS system. Πεπιγπαθή Δπγαζίαρ - Βαθμόρ Τλοποίηζηρ ηυν ηόσυν ηηρ Γέζμηρ Δπγαζίαρ / Work Description - Degree of Work Package Objectives Implementation The WP3 has been completed as scheduled. The corresponding deliverables (D9 and D10) have been delivered in time and are attached in the present report. Μεθοδολογία και Αποηελέζμαηα Methodology and Results The aim of this WP was the installation and the fine tuning of the numerical models, that were used for the production of the data on which the Ewave project analysis were based, to the infrastructure of the third partner the Ocean Analysis and Prediction Laboratory, Naval Postgraduate School (NPS), USA. To this end the following actions have been taken: The atmospheric simulations needed for the project were based on the modeling system Skiron developed by the partner Atmospheric Modeling Group of the University of Athens (AM&WFG-UOA). The system has been set up, validated against available observations and other operational forecasting systems, and fine-tuned taking into account the local characteristics of area under study. The simulations performed by the atmospheric model covered a 10-year period ( ) providing the necessary atmospheric forcing for the wave simulations. The latter have been based on the wave model WAM (ECMWF parallel version). This is a widely used and well tested third generation wave model that has been adopted by a great number of research and operational centers worldwide. The wave model was set up at the US-NPS computer system by the scientists of the Oceanography Center of the University of Cyprus in cooperation with the US colleagues. 14
15 Sensitivity tests have been performed for this model too targeting to the optimization of the results. The whole operational system (atmospheric and wave model) was supervised by a series of Unix scripts developed on the parallel grid system of NPS infrastructure. All the details of the models and the operational system used are presented in a technical report (Deliverable No 10 of the project, Appendix No. 21). An additional action taken within the framework of this WP concerns the compilation of the new wind/wave system with the CYCOFOS platform that is running operational at Cyprus Oceanographic Center providing wave and oceanographic forecasts ( In this way, an essential update of the wave system was achieved that takes advantage of the new features of the wave model (new advection scheme and novel parameterizations for the simulation of extreme wave values) and providing novel forecasting capabilities. The new wind/wave system operates at the best resolution (0.01 degrees) reached in the area by any other research or operational institute. A full backup of the system, including the models and the associate operational script, are provided in electronic form (Deliverable No 9). Παπαδοηέα Deliverables D9 The new version of the wave model WAM installed at the USA NPS grid super computer with all of its parameters tuned so to meet the local environment characteristics The wave model WAM has been installed, tested and tuned at the USA-NPS grid computer system. A full copy of the system, including the models and the supervising operational script, are provided in electronic form. D10 A technical note describing the use of the wave model at the new computer environment, the abilities and restrictions of the system The technical note presenting the details of the models and the operational system used is attached (Appendix No. 21) 15
16 Σίηλορ Γέζμηρ Δπγαζίαρ Work Package Title Κυδικόρ Φοπέα Partner Code Ανθπυπομήνερ για κάθε Φοπέα (με βάζη ηο ςμβόλαιο) Personmonths per Partner (according to the Contact) Γεδοςλεςμένοι Ανθπυπομήνερ για κάθε Φοπέα Personmonths Worked per Partner WP 4 : Development of new advanced models for optimization and prediction ΑΦ / HO ΣΦ1 / PA1 ΣΦ2 / PA2 ΣΦ3 / PA3 ΣΦ4 / PA ηόσοι Γέζμηρ Δπγαζίαρ (όπυρ πεπιγπάθονηαι ζηο Παπάπηημα Ι ηος ςμβολαίος) Work Package Objectives (as described in Annex I of the Contract) Develop new mathematical models for the optimization and local adaptation of wave forecasts Develop a statistical system for the evaluation of energy potential based on sea wave characteristics. Πεπιγπαθή Δπγαζίαρ - Βαθμόρ Τλοποίηζηρ ηυν ηόσυν ηηρ Γέζμηρ Δπγαζίαρ / Work Description - Degree of Work Package Objectives Implementation The WP3 has been completed as scheduled. The corresponding deliverables (D11, D12 and D13) have been delivered in time and are attached in the present report as Appendixes Μεθοδολογία και Αποηελέζμαηα Methodology and Results The main target of WP4 was the development of new post-process models for the optimization of the outputs of the numerical atmospheric and wave models developed in WP3 and the appropriate adaptation of their results to local area characteristics. This was an essential target since it is a common fact for the research community working on environmental issues today that, while new generation environmental numerical models provide accurate results when working on global or mesoscale domains, when one focuses on restricted areas trying to obtain very detailed local information, systematic biases may appear. Such problems are related with the fact that the model outputs are strongly depended on local characteristics and initial conditions as well as to the difficulties in simulating successfully sub-grid scale phenomena especially in areas with complicated coastal formations where overshadowing and inaccurate refraction wave features are usual problems. Despite the above difficulties and taking into account that for the Ewave project local area environmental information is essential in order to estimate successfully the associated wave energy revealing the areas with increased wave power potential. In the framework of WP4, state of the art statistical techniques have been developed and utilized, 16
17 towards the optimization of the results of the wave system in use and the elimination of possible systematic biases. The models used are based on Kalman and Kolmogorov-Zurbenko filters that utilize local (in situ) observations. These tools and the corresponding methodology are presented in Appendixes 22 and 23. A second important goal of the WP4 was the study and utilization of statistical methodologies for the reliable estimation of energy potential at the area of interest based on the local environmental characteristics. To this end, a novel statistical analysis tool has been developed by the University of Athens and the Oceanography Center of the University of Cyprus. A variety of statistical indexes are provided by the technique developed in conjunction with probability density function fitting tests for the significant wave height and the mean wave period values as simulated by the wave model WAM. These parameters directly affect the estimation of the local wave energy potential. The personnel of the partners were trained for the optimal use of these statistical systems by the scientists of Host Organization. A detailed presentation of the above discussed system and the corresponding code is given in Appendixes 24 (Deliverable No. 12 of the project) and 25 (Deliverable No. 13). Παπαδοηέα Deliverables D11 A new mathematical model for the optimization and local adaptation of the results of numerical wave predictions. The code of the mathematical model developed and the associated supervising script are given in Appendix 22. D12 A statistical system for the estimation of local energy potential based on sea wave characteristics. The scripts and the code of the wave power estimation system are given in Appendix 24. D13 A technical report describing the development, the technical details and the use of the mathematical-statistical models used for the local adaptation and power estimation. A detailed technical report of the models developed and used for the local adaptation of the results and the power estimation is given in Appendix
18 Σίηλορ Γέζμηρ Δπγαζίαρ Work Package Title Κυδικόρ Φοπέα Partner Code Ανθπυπομήνερ για κάθε Φοπέα (με βάζη ηο ςμβόλαιο) Personmonths per Partner (according to the Contact) Γεδοςλεςμένοι Ανθπυπομήνερ για κάθε Φοπέα Personmonths Worked per Partner WP 5 : Operational use of the integrated system ΑΦ / HO ΣΦ1 / PA1 ΣΦ2 / PA2 ΣΦ3 / PA3 ΣΦ4 / PA ηόσοι Γέζμηρ Δπγαζίαρ (όπυρ πεπιγπάθονηαι ζηο Παπάπηημα Ι ηος ςμβολαίος) Work Package Objectives (as described in Annex I of the Contract) Set the system developed in WPs 3 and 4 to an operational mode running for a period of 10 years. Develop a complete data base containing detailed sea state results for the EEZ of Cyprus. Πεπιγπαθή Δπγαζίαρ - Βαθμόρ Τλοποίηζηρ ηυν ηόσυν ηηρ Γέζμηρ Δπγαζίαρ / Work Description - Degree of Work Package Objectives Implementation The work scheduled to be done in this WP, which was referred to the operational run of the atmospheric and wave system for a ten year period, has been completed successfully. Both numerical models have been smoothly operated as scheduled. A data base in which the sea state simulation outputs for the EEZ of Cyprus has been also developed. Μεθοδολογία και Αποηελέζμαηα Methodology and Results WP 5 was devoted to the operational run of the integrated system developed in the WPs 3 and 4 that would develop the data base of environmental parameters in the Levantine area on which the analysis of the project is based. To this end, the following actions have been taken: The two numerical models that have been set up at US Naval Postgraduate School infrastructure - the atmospheric system Skiron/Eta and wave model WAM, was operated in a hindcast mode for a 10-year period ( ) providing high resolution (spatially and temporally) data sets concerning the main parameters that affect the wave energy potential estimation: The Significant Wave Height and the Mean Wave Period. A detailed quality control for the obtained data has been performed by the AM&WFG- UOA in order to remove possible outliers by rebuilding and rerunning the corresponding simulations. Evaluation results against in-situ observations proved that the simulation system develop is of excellent accuracy (see [Galanis G. et al., The E-wave project: Estimation of wave power potential in Cyprus, 10th PanHellenic Symposium of Oceanography and Fishery, Athens 2012] (Appendix 12). The statistical analysis and the evaluation of the simulation results were significantly supported by a 18
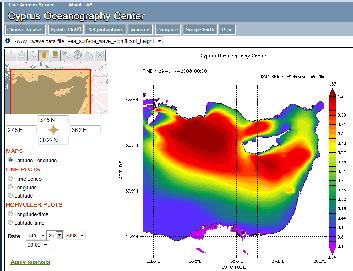
19 state of the art visualization and analysis tool that has been set up and tested by the Oceanography Center of the University of Cyprus. It is the LAS (Live Access Server) system developed and distributed by the National Oceanic and Atmospheric Administration of the United States (NOAA). This system has been designed to provide flexible access to geo-referenced scientific data and has remarkable capabilities on supporting the archiving of the results, the dynamic visualization in a user friendly platform as well as detailed statistical analysis. Some indicative outputs of LAS system can be found in Appendix 6. An electronic data base (Deliverable No. 14) containing all the simulations outputs has been set up in the infrastructure of the Oceanography Center of the University of Cyprus and can be electronically reached at Moreover, the main statistical indexes for the parameters that directly affect the wave energy potential estimation are summarized in the Appendix 26 (dvd). A more detailed description of LAS based data base is provided in Appendix 25 (Deliverable No. 15). Παπαδοηέα Deliverables D14 A complete wave data base containing detailed information for the major sea wave characteristics at the EEZ of Cyprus The wave data base has been set up at the infrastructure of the Oceanography Center of the University if Cyprus and is available at The main statistical results are also provided in the Appendix 26 (dvd). D15 A technical report in which different ways of exploiting the results of the data base will be clarified The technical report on the data base capabilities and use is attached as Appendix
20 Σίηλορ Γέζμηρ Δπγαζίαρ Work Package Title Κυδικόρ Φοπέα Partner Code Ανθπυπομήνερ για κάθε Φοπέα (με βάζη ηο ςμβόλαιο) Personmonths per Partner (according to the Contact) Γεδοςλεςμένοι Ανθπυπομήνερ για κάθε Φοπέα Personmonths Worked per Partner WP 6 : Development of the wave and energy atlases ΑΦ / HO ΣΦ1 / PA1 ΣΦ2 / PA2 ΣΦ3 / PA3 ΣΦ4 / PA ηόσοι Γέζμηρ Δπγαζίαρ (όπυρ πεπιγπάθονηαι ζηο Παπάπηημα Ι ηος ςμβολαίος) Work Package Objectives (as described in Annex I of the Contract) Develop a complete wave atlas for the sea characteristics in the EEZ of Cyprus, South-East Mediterranean Develop an integrated energy potential atlas for the same region Πεπιγπαθή Δπγαζίαρ - Βαθμόρ Τλοποίηζηρ ηυν ηόσυν ηηρ Γέζμηρ Δπγαζίαρ / Work Description - Degree of Work Package Objectives Implementation The main target of the last WP of the project was the compilation of the results obtained by the 10-year simulation study to integrated high resolution atlases in which the sea characteristics of the EEZ of Cyprus and the wave energy potential in the area will be depicted. The above goals have been succeeded as scheduled and the main outcomes are discussed in the next section. Μεθοδολογία και Αποηελέζμαηα Methodology and Results WP 6 is the concluding part of the project within the framework of which the outcomes of the previous WPs, including the simulation results obtained by the operational run of the modeling systems and the statistical tools and data base developed are utilized towards two complete atlases: - The first atlas summarizes the main wave characteristics of the EEZ of Cyprus covering the major sea state parameters, the significant wave height/direction and the wave period, that directly affect the wave energy potential. -In the second one a number of charts are provided in which the wave energy potential is monitoring over the EEZ of Cyprus but also of the general Levantine area. For both cases, a very high spatial and temporal resolution has been adopted that makes possible the detailed description/study of the areas with increased wave power potential and, therefore, advantageous for establishing wave energy production systems. Both atlases are available in electronic form on the dedicated server of the Oceanography Center of the 20
21 University of Cyprus: while the main statistical indexes describing the wave and energy atlases are provided in Appendix 25. The principal conclusions of the above study based on a detailed statistical analysis, where a variety of statistical measures monitoring expected values, variation, asymmetry and potential impact of extreme values as well as probability density functions fitting, can be summarized as follows: Wave height values over the area have a non-trivial decadal variation with increased normalized by the mean value kurtosis and standard deviation. The wave period, on the other hand, appears much more stable and normally distributed. Low wave energy potential of about 2 kw/m 10 year mean characterizes the Cyprus Sea area. The swell dominated western coastline of the island is the area with the highest mean values of wave energy potential (2.5 kw/m) with relatively low variability. There is a generally stable yearly behavior of wave power values which, however, is exposed to increased extreme values impact as the elevated positive kurtosis values indicate. The significant spatial variability of kurtosis values is a critical characteristic of the area revealing the importance of high resolution studies in site selection. The wave energy potential modeled values are well described by the 2-parameter lognormal distribution during the period October-March while the Generalized Extreme Values distribution is closely to the data during April September. However, a non-negligible spatial distribution of the corresponding scale and shape parameters is revealed. The Cyprus Energy Agency (PA3) has worked a lot in the dissemination of the project exceeding the 5 man-months, as the coordinator decided that the input of CEA in the WP2 was more important and eliminated the input in the WP6. However, the overall staff cost in the approved budget remains unchanged. Παπαδοηέα Deliverables D16 A wave atlas for the EEZ of Cyprus D17 An energy potential atlas for the EEZ of Cyprus Both atlases have been compiled on the host institute (Oceanography Center of the University of Cyprus) dedicated server and can be reached at The main statistical indexes that describe-summarize the wave and energy atlases are provided in Appendix
22 Α.4. ΠΙΝΑΚΑ ΓΔΜΧΝ ΔΡΓΑΙΑ / WORK PACKAGES TABLE Γέζμη Δπγαζίαρ Work Package Σίηλορ Γέζμηρ Δπγαζίαρ Work Package Title Έναπξη (μήναρ) Start Month Ολοκλήπυζη (μήναρ) End Month Παπαδοηέα Deliverables ΓΔ1 WP1 Project Management 1 24 D1, D2, D3 ΓΔ2 WP2 Dissemination of Results D4, D5, D6, D7, D8 ΓΔ3 WP3 Implementation and tuning of the wave model 1 6 D9, D10 ΓΔ4 WP4 Development of new advanced models for optimization and prediction 1 8 D11, D12, D13 ΓΔ5 WP5 ΓΔ6 WP6 Operational use of the integrated system 7 18 D14, D15 Development of the wave and energy atlases D16, D17 22
23 Α5. ΑΞΙΟΠΟΙΗΗ ΑΠΟΣΔΛΔΜΑΣΧΝ ΚΑΙ ΠΡΟΣΙΘΔΜΔΝΗ ΑΞΙΑ / EXPLOITATION OF RESULTS AND ADDED VALUE Αναθέπονηαι επιγπαμμαηικά οι ηπόποι αξιοποίηζηρ ηυν αποηελεζμάηυν πος πποέκςταν από ηο Έπγο και η πποζηιθέμενη ηοςρ αξία. Briefly describe the added value of Project results and ways for their exploitation. The exploitation of different forms of renewable energy resources is today a high priority issue worldwide. Especially the last decades a very demanding framework has been set for the technical and research community that works in relevant fields by the novel policies adopted by several countries and Unions under the warnings of the scientific community for the global warming, the rapid increase of oil-depended energy sources and the concerns raised for the security of nuclear infrastructures. In this framework, the wave energy, that is the energy that can be produced by sea waves, is receiving increased attention due to some critical advantages compared to other forms of clean energy: it can be exploited even in the absence of local winds by swell, long distance travelled, waves that have been created away from the area of interest. On the other hand, the wave energy values have relatively low variability, especially when compared with the wind energy, that allows the easier adaptation to the general grid. Despite these advantages, wave energy and relevant applications have a long distance to cover before the associated technology reaches the maturity level of its wind and photovoltaic counterparts. The Ewave project was a pioneer activity for the area. An excellent framework of cooperation has been developed between leading Universities and operational centers of the European Union and the United States, that gave to the partners the opportunity to develop and use state of the art techniques and methodologies for monitoring the wave energy potential characteristics in the Exclusive Economical Zone of Cyprus, and the Levantine area in general, to reveal the main its characteristics in a very detailed way and to spot areas of increased interest, that are advantageous for the development of wave energy exploitation platforms. 23
24 In particular, the work performed within the framework of the project: Revealed that there is a significant potential of the wave energy in specific areas of the EEZ of Cyprus, and the Levantine in general. Monitored and mapped this potential in a detailed way in the high resolution atlases developed that provide detailed information for the local climate wind/wave characteristics and the spatial and temporal distribution of the wave power potential. Provide the local authorities and end-users with critical tools and novel methodologies that can be used for the wave energy quantification and prediction and, therefore, the selection of areas with increased wave power potential and organize their exploitation, leading to the reduction of dependence by oil-based energy forms. Allows the state and commercial sector to have an accurate estimation of the available wave energy potential in the area in short or long forecasting horizons by means of the new forecasting platform developed. Increased the existing knowledge and technical skills of the scientists in Cyprus and the partners on the rapid developing renewable energy resources supporting sciences, and established a solid connection between Cyprus, Greek and US research teams that can, and should, be exploited for future development and progress. 24
25 Μ Δ Ρ Ο Β / P A R T B ΠΑΡΑΡΣΗΜΑ Β1 / ANNEX B1 A P P E N D I X E S Appendix 1: Ε-WAVE project extension claim Appendix 2: Ε-WAVE project extension approval Appendix 3: Workshop Announcement Appendix 4: Ewave workshop List of Participants Appendix 5: Articles in newspapers Appendix 6: LAS visualization and statistical analysis system characteristic plots Appendix 7: NPS Seminar Appendix 8: Munities of the meeting with local authorities Appendix 9: Newsletters of the Ε-WAVE project Appendix 10: Paper 1 published in peer reviewed journal Appendix 11: Paper 2 published in peer reviewed journal Appendix 12: Paper 1 published in the proceedings of international conference Appendix 13: Paper 2 published in the proceedings of international conference Appendix 14: Paper 3 published in the proceedings of international conference Appendix 15: Paper 4 published in the proceedings of international conference Appendix 16: Poster 1 published in the proceedings of international conference Appendix 17: Poster 2 published in the proceedings of international conference Appendix 18: Poster 3 published in the proceedings of international conference Appendix 19: Paper 5 published in the proceedings of international conference Appendix 20: Proceedings of the international workshop (DVD) Appendix 21: The wave model WAM at the US NPS computer system (Technical Report) 25
26 Appendix 22: A new mathematical model for the optimization and local adaptation of the results of numerical wave predictions (operational scripts and code). Appendix 23: Technical report describing the development, the technical details and the use of the mathematical-statistical models used for the local adaptation and power estimation Appendix 24: A statistical system for the estimation of local energy potential based on sea wave characteristics (operational scripts and code). Appendix 25: The data base of the E-Wave project - Technical Report Appendix 26: Wave Atlases Appendix 27: NPS report for first period payments Appendix 28: NPS report for second period payments Appendix 29: UOA request 1 for replacing a group member Appendix 30: UOA request 2 for replacing a group member Appendix 31: UOA request 3 for replacing a group member Appendix 32: CVs of the new members of the UOA research team Appendix 33: UOA report for the first period payments Appendix 34: UOA report for the second period payments Appendix 35: Submitted paper on the Wave Energy Potential in the Eastern Mediterranean Levantine Basin. 26
27 ΠΑΡΑΡΣΗΜΑ Β2 / ANNEX B2 D E L L I V E R A B L E S Δπιζςνάπηονηαι ηα Παπαδοηέα ηος Έπγος πος μποπούν να δοθούν ζε ένηςπη μοπθή ζε ένα μόνο ανηίγπαθο (απιθμημένα ζύμθυνα με ηο ςμβόλαιο). Please attach one copy of all Project Deliverables which can be provided in print format (numbered according to the Contract). No Title Type of Deliverable Completion (Project Month) D1 Six-monthly Periodic Progress Reports Report 6, 12, 18, 24 D2 Intermediate report and reports for the monitoring group meetings. Report 4, 8, 12, 16, 20 D3 Final report Report 24 D4 D5 D6 D7 D8 D9 Proceedings of the international workshop in which all the results of the project as well as relevant publications and presentations from end-users and independent scientists active in energy area will be included A web page presenting all the activities of the project One research article published in a peer reviewed international journal Five research articles presented to international conferences and published in the corresponding proceedings. Proceedings of the meeting(s) with the local authorities-organizations-end users. The new version of the wave model WAM installed at the USA NPS grid super computer with all of its parameters tuned so to meet the local environment characteristics Comments All the reports of the project have been delivered on time to RPF. Publication 20 Attached in electronic form as Appendix No. 20 Software 3 Publication 24 Publication 24 Publication 24 Software 6 The web page of the project is available online at Two research articles relevant to the project have been published in scientific journals (Appendixes 10, 11) and one more has been submitted for publication (Appendix 35) Eight research articles, have been presented to international conferences and published in the corresponding proceedings (Appendixes 12-19). The minutes of the meeting with the local authorities-organizations-end users can be found in Appendix 8. The wave model WAM has been installed, tested and tuned at the USA-NPS grid computer system. A full copy of the system, including the models and the supervising operational script, are provided in electronic form. D10 A technical note describing the use of the wave model at the new computer environment, the abilities and restrictions of the system Report 6 The technical note presenting the details of the models and the operational system used is attached as Appendix No
28 D11 D12 D13 D14 D15 A new mathematical model for the optimization and local adaptation of the results of numerical wave predictions. A statistical system for the estimation of local energy potential based on sea wave characteristics. A technical report describing the development, the technical details and the use of the mathematical-statistical models used for the local adaptation and power estimation A complete wave data base containing detailed information for themajor sea wave characteristics at the EEZ of Cyprus A technical report in which different ways of exploiting the results of the data base will be clarified Software 7 Software 8 Report 9 Database 18 Report 18 D16 A wave atlas for the EEZ of Cyprus Wave Atlas 24 D17 An energy potential atlas for the EEZ of Cyprus Energy Atlas 24 The code of the mathematical model developed and the associated supervising script are provided in Appendix 22 The scripts and the code of the wave power estimation system are given in Appendix 24. The technical report is attached as Appendix 23 The wave data base has been set up at the infrastructure of the Oceanography Center of the University if Cyprus and is available at visualization-tool/. The main statistical results are also provided in the Appendix 26 (dvd) The technical report is attached as Appendix 25. Both atlases have been set up at a dedicated server of the Oceanography Center of the University of Cyprus and can be reached at visualization-tool/ The main statistical indexes that describesummarize the wave and energy atlases are provided in Appendix 26 ημείυζη: Η ζςλλογή και επεξεπγαζία δεδομένυν πποζυπικού σαπακηήπα πος πεπιέσονηαι ζηιρ Δκθέζειρ Πποόδος οι οποίερ ςποβάλλονηαι ζηο ΙΠΔ για έλεγσο ηος οικονομικού & επιζηημονικού ανηικειμένος ηος Έπγος, γίνεηαι με εμπιζηεςηικόηηηα και ζύμθυνα με ηον πεπί Δπεξεπγαζίαρ Γεδομένυν Πποζυπικού Χαπακηήπα (Πποζηαζία ηος Αηόμος) Νόμο ηος 2001 και ηον Κανονιζμό ηος ΙΠΔ ζε σέζη με ηη ςλλογή, Δπεξεπγαζία και Χπήζη Γεδομένυν Πποζυπικού Χαπακηήπα, ο οποίορ βπίζκεηαι αναπηημένορ ζηην ιζηοζελίδα ηος Ιδπύμαηορ ( 28
29 APPENDIX I Κπξία Λήδα θνπθάξε-θεκηζηνύ Δπηζηεκνληθό Λεηηνπξγό Σνκέα Πξνγξακκάησλ Κππξηαθήο Δπηρνξήγεζεο Ίδξπκα Πξνώζεζεο Έξεπλαο, Κπξία θνπθάξε-θεκηζηνύ, Με ηελ παξνύζα επηζηνιή ζα ήζεια λα ζαο ελεκεξώζσ γηα ηα πξνβιήκαηα πνπ έρνπλ δεκηνπξγεζεί ζηελ εθηέιεζε ηνπ έξγνπ «Integrated High Resolution System for Monitoring and Quantifying the Wave Energy Potential in the EEZ of Cyprus» (Ewave, αξ. Πξσηνθόιινπ ΣΔΧΝΟΛΟΓΗΑ/ΔΝΔΡΓ/0609(ΒΗΔ)/01) ιόγσ ηεο ζεκαληηθήο θαζπζηέξεζεο ηεο θαηαβνιήο ηεο δεύηεξεο (ελδηάκεζεο) δόζεο ηεο ρξεκαηνδόηεζεο από ην ΗΠΔ ε νπνία πξέπεη λα αλέξρεηαη έσο θαη ζην 45% ηεο ζπλνιηθήο ρξεκαηνδόηεζεο ηνπ έξγνπ. εκεηώλεηαη όηη ε ελδηάκεζε έθζεζε ηνπ έξγνπ έρεη ππνβιεζεί πξνο ην ΗΠΔ από ηηο 10/02/2012. Δπίζεο, ιεηηνπξγνί ηνπ ΗΠΔ επηζθέθηεθαλ ηηο εγθαηαζηάζεηο ηνπ αλάδνρνπ θνξέα (Ωθεαλνγξαθηθό Κέληξν, Παλεπηζηήκην Κύπξνπ) θαη ελεκεξώζεθαλ γηα ηελ πξόνδν ηνπ έξγνπ ζηηο 23/05/2012 ελώ ην έξγν νινθιεξώλεηαη ζηηο 02/01/2013 Ζ παξαπάλσ θαζπζηέξεζε έρεη δεκηνπξγήζεη ζεκαληηθέο δπζθνιίεο ζε ζπλεξγαδόκελνπο θνξείο ηνπ έξγνπ, θαη ζπγθεθξηκέλα ζην Παλεπηζηήκην Αζελώλ, ζην Naval Postgraduate School, USA, θαη ζην Δλεξγεηαθό Γξαθείν Κππξίσλ Πνιηηώλ νη νπνίνη δελ είραλ δηαζέζηκνπο ηνπο πόξνπο πνπ ην έξγν πξνβιέπεη γηα ηελ θάιπςε ησλ εξεπλεηώλ πνπ εκπιέθνληαη ζηηο δέζκεο εξγαζίαο 2, 5 θαη 6 θαη ζηα παξαδνηέα κε αξηζκό D8, D16 θαη D17.
30 Με βάζε ηα παξαπάλσ, θαη γηα ηελ εμαζθάιηζε ηεο νκαιήο νινθιήξσζεο ηνπ έξγνπ αιιά θαη ηεο δπλαηόηεηαο απνξξόθεζεο ησλ ζρεηηθώλ θνλδπιίσλ, πξνηείλεηαη ε παξάηαζε ηνπ έξγνπ γηα 3 κήλεο ρσξίο ηελ έγθξηζε επηπιένλ ρξεκαηνδόηεζεο. Ζ παξάηαζε απηή θξίλεηαη σο ηθαλνπνηεηηθή γηα ηελ νινθιήξσζε ησλ παξαπάλσ δεζκώλ εξγαζίαο θαη παξαδνηέσλ πνπ έρνπλ επεξεαζηεί από ηελ θαζπζηέξεζε, ππό ηελ πξνϋπόζεζε όηη ε εθηακίεπζε ηεο ελδηάκεζεο δόζεο ρξεκαηνδόηεζεο ζα νινθιεξσζεί ζε ζύληνκν ρξνληθό δηάζηεκα. Γξ. Γεώξγηνο Εσδηάηεο, Vice Director, Oceanography Centre University of Cyprus P.O. Box Nicosia, CYPRUS Tel: , Fax: gzodiac@ucy.ac.cy
31
32
33
34
35
36 List of Speakers & Participants Workshop - Speakers Wave Energy Potential in the Eastern Mediterranean Sea Quantification and Exploitation Social Facilities Building, Room 010, University of Cyprus New Campus, Nicosia, 9 July 2012, Cyprus Name & Surname 1. Andreas Poullikkas Position Organization Telephone Fax Assistant Manager Electricity Authority of Cyprus 2. Nadia Pinardi Professor University of Bologna 3. Soteris Kalogirou Professor Cyprus University of Technology apoullik@eac.com.cy n.pinardi@sincem.unibo.it soteris.kalogirou@cut.ac.cy George Kallos Professor University of kallos@mg.uoa.gr Athens 5. George Galanis Assistant University of ggalanis@mg.uoa.gr Professor Athens 6. Per Resen CEO Resen Energy prs@resen.dk Steenstrup 7. Adam Gauci Assistant Lecturer University of Malta adam.gauci@um.edu.mt
37 List of Speakers & Participants Name & Position Organization Telephone Fax Surname 8. Kostas Nittis Chairman Marine Board of the European Scientific Foundation 9. Mario Adani Researcher Istituto Nazionale Geofisica e Vulcanologia mario.adani@bo.ingv.it Evridiki Chrisagi MSc Student 11. George Zodiatis Vice Director 12. Kostas Belibassakis Associate Professor National and Kapodistrian University of Athens Oceanography Center University of Cyprus National Technical University of Athens x.evridiki@hotmail.com gzodiac@ucy.ac.cy kbel@fluid.mech.ntua.gr
38 List of Speakers & Participants Workshop - Participants Wave Energy Potential in the Eastern Mediterranean Sea Quantification and Exploitation Social Facilities Building, Room 010, University of Cyprus New Campus, Nicosia, 9 July 2012, Cyprus Name & Position Organization Telephone Fax Surname 13. Perdro Jorge Technical Agencia Municipal de geral@ames.pt Oliviera Director Energia de Sintra 14. Luis Manuel Administrator Agencia Municipal de geral@ames.pt Fernandes Energia de Sintra 15. Christos Fisheries Department of c.ioakeim@yahoo.com Ioakimides Officer Fisheries 16. Avgi Botsari Student University of avgibo@gmail.com Liverpool 17. Bob Brant Project CSnet bbrant@csnetinternational.com Engineer 18. Kenneth COO CSnet ksharp@csnetinternational.com Morton Sharp 19. Andreas Associate University of Cyprus akyp@ucy.ac.cy Kyprianou Professor 20. Ellinas Christos Engineer Ellinas Energy Cyprus christos@ellinas-energy.com Michalis Kalathas 22. Louis Patsalides General Manager General Manager NMC.KALACONSULT m.kalathas@kalaconsult.com & ASSOCIATES LTD AB Agropolis Ltd loizos.patsalidis@cytanet.com.cy
39 List of Speakers & Participants Name & Surname 23. Christodoulos Pharconides 24. Andreas Protopapas 25. Antonis Toumazis 26. Polycarpos Polycarpou Position Organization Telephone Fax General Manager Project Manager Partner Chief Agricultural Research Officer Energy Officer Ergo Home Energy Ltd om PROTONICS Dion. Toumazis & Associates Agricultural Research Institute 27. Maria-Eleni Delenta Cyprus Energy Regulatory Authority 28. Angela Scientific I.A.CO Environmental Nikolaou Personnel & Water Consultans Ltd 29. Ayis Iacovides Director I.A.CO Environmental & Water Consultans Ltd Manfred Director Cyprus Institute Lange 31. Elisa Bertinelli Sales 40South Energy Executive om 32. Massimo Technical 40South Energy Sacchi Director.com 33. Marios Officer Meteorological Theofilou Service Cyprus 34. Christos General Ioannou Alternative Ioannou Manager Energy LTD 35. Panayiota Panayiotou Engineer Ioannou Alternative Energy LTD

40 List of Speakers & Participants Name & Surname 36. Andreas Christofides 37. Marios Drousiotis Position Organization Telephone Fax Director of Administration and Finance Officer University of Cyprus Maritime Institute of Eastern Mediterranean Wincono Cyprus Ltd Sylvia Trabert Managing Director 39. Makis Ketonis Managing Wincono Cyprus Ltd Director 40. Nicolas Lecturer Frederick University Christofides 41. Corina Economic Embassy of Romania Rechitean counellor in Nicosia 42. Vaniel Naci Specialist of Renewable AKBN Energy 43. Filippos Meteorologica Tymvios l Officer A Cyprus Meteorological Officer A 44. Georgios Student (UEA) Nikolaidis_g@gotmail.com Nikolaidis 45. Georgia Panayi Student Panayi_geo@hotmail.com 46. Orestis Kyriacou 47. Anthi Charalambous Energy Management Officer Director Cyprus Energy Agency Cyprus Energy Agency orestis.kyriakou@cea.org.cy anthi.charalambous@cea.org.cy


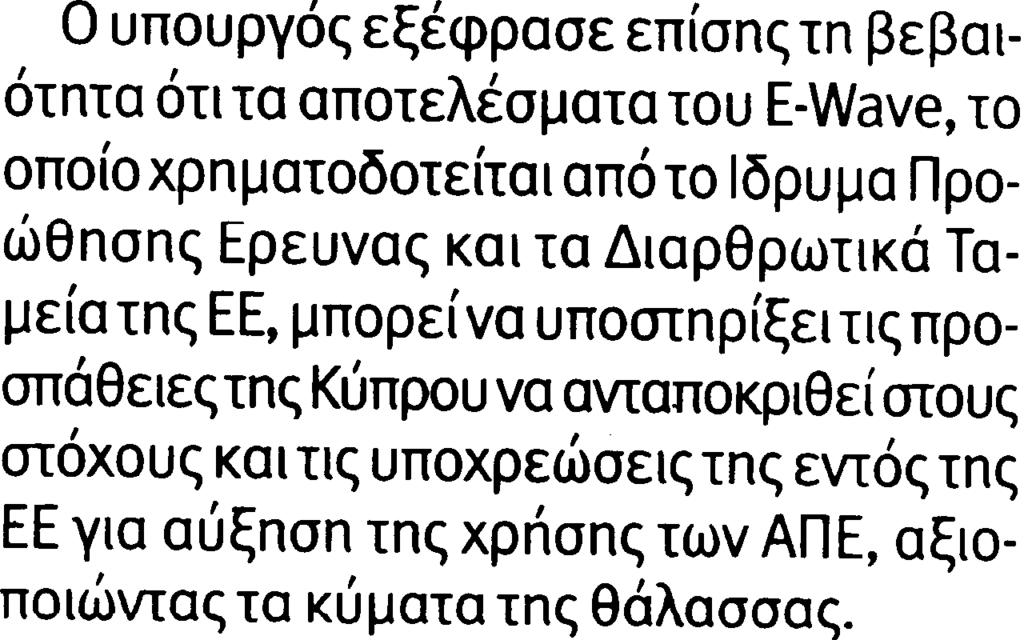
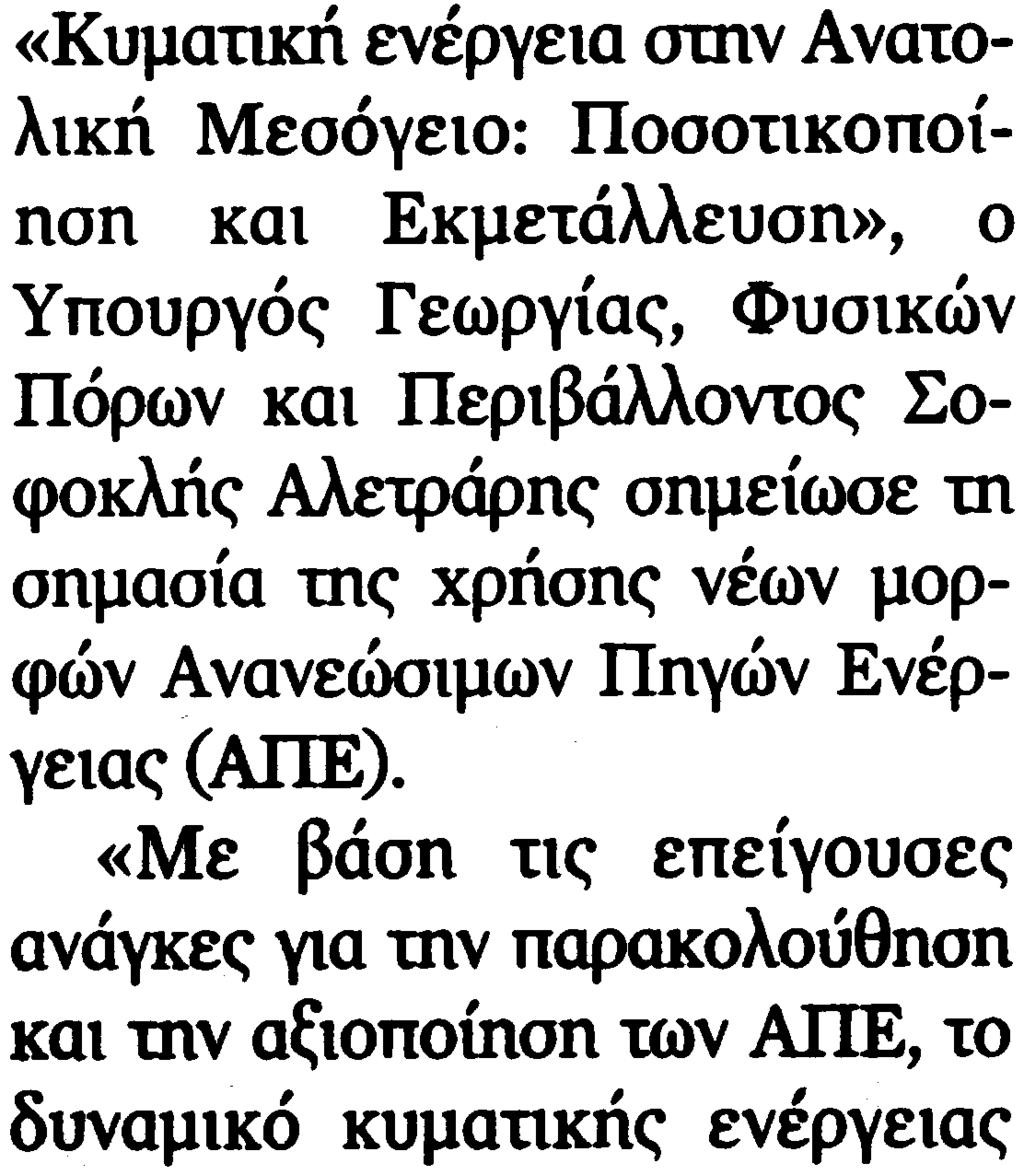
41 ΦΙΛΕΛΕΥΘΕΡΟΣ Τριτη, 10 Ιουλιος 2012, p. 4


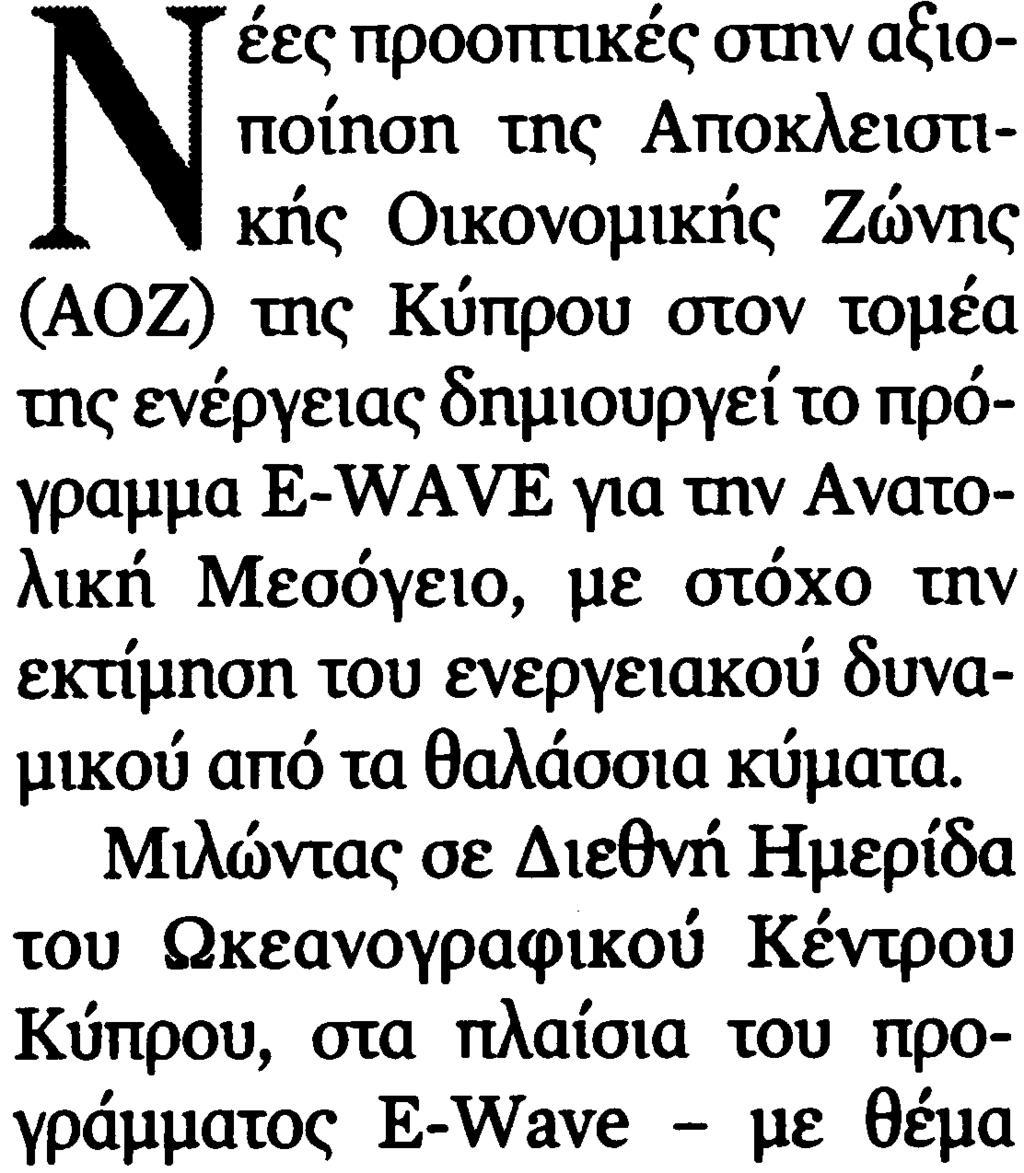
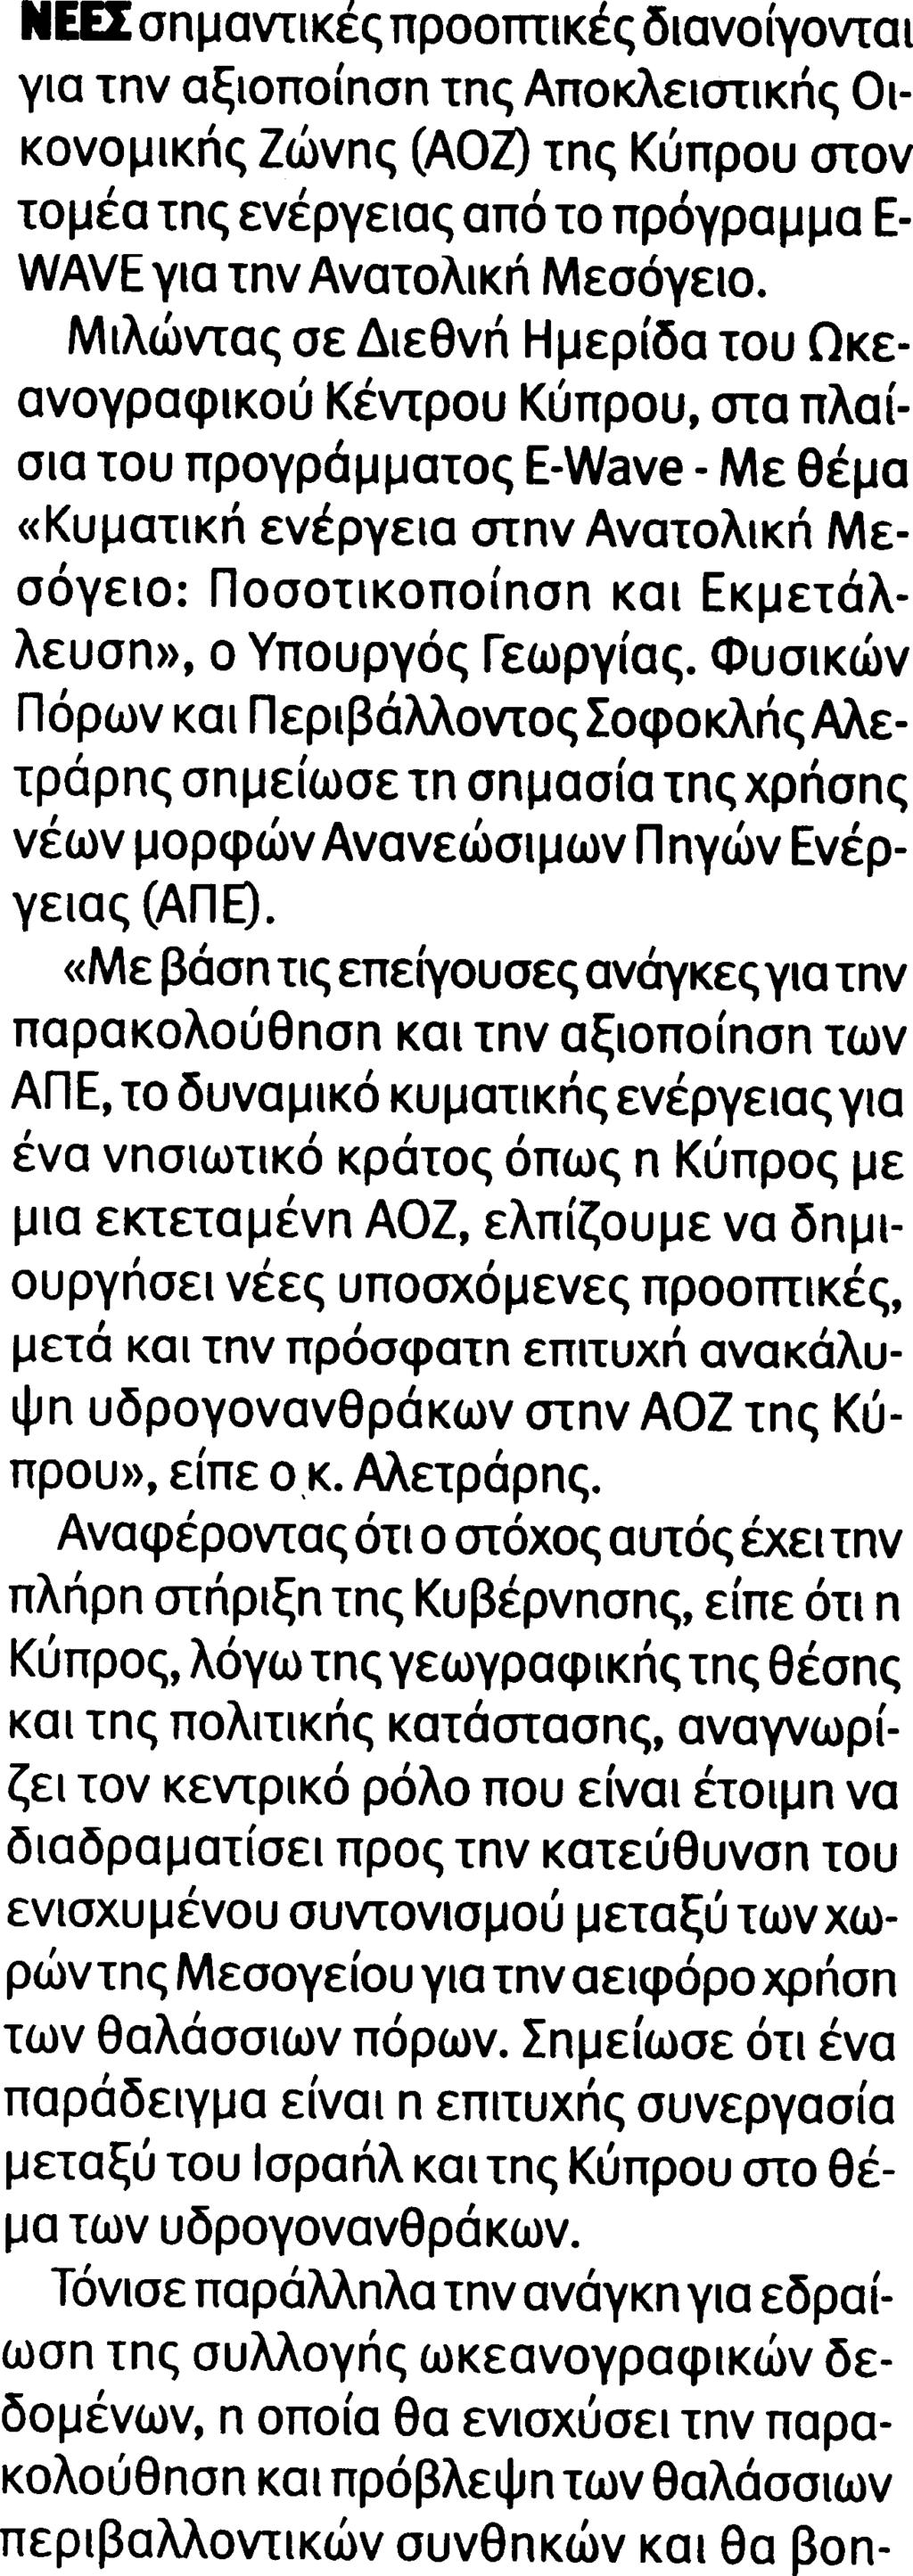
42 ΧΑΡΑΥΓΗ Τριτη, 10 Ιουλιος 2012, p. 10

43 ΧΑΡΑΥΓΗ Τριτη, 10 Ιουλιος 2012, p. 10
44

45 Appendix 6 Sample plots of the LAS visualization and statistical analysis system
46 Appendix 7 Department of Oceanography Naval Postgraduate School Monterey, CA August 2, 2011 Oceanography Seminar SPEAKER: George Galanis AFFILIATION: Greek Naval Academy and Oceanography Center, University of Cyprus TITLE: E-wave project: Estimation of the wave energy potential based on numerical wave modeling and statistical techniques DATE: Monday, August 8, 2011 TIME: 3:00 PM PLACE: Naval Postgraduate School, Room: Spanagel 316 ABSTRACT In the last few years, a new highly demanding and competitive framework has been set for scientific applications that focus on environmental issues. This is a result of the needs posed by new, urgent in some cases, issues that are of interest not only of the scientific community but of the today s society in general: Global warming, climate change, renewable resources of energy, can be listed among them. The issue of renewable energy is particularly highlighted since new facts and needs have been revealed by the global economic crisis and the security problems concerning the nuclear energy. In this presentation, some recent results concerning a rapidly developing sector of renewable energy, the wave energy, will be discussed. The Naval Ocean Analysis and Prediction Laboratory of NPS participates in a new European project the E-wave project focusing on the estimation of the energy that can be produced by the sea waves in the eastern Mediterranean Sea. On the other hand, the University of Athens with 16 other European Institutes joined a similar project for the wave energy potential estimation in the Atlantic coastline of Europe. The results obtained so far in these projects will be outlined focusing on the mathematical and physical models that have been utilized. NOTE: Gate access requires 48 hour notice. Please notify the oceanography office ( ) if you need to be placed on the gate access list.
47 Πρακτικά ςυνάντηςησ ςτρογγυλθσ τραπέζησ με τοπικοφσ φορείσ υζθτηςη των αποτελεςμάτων του έργου E-WAVE Παραςκευθ 1 Φεβρουαρίου 2013, ώρα πμ Αίιουςα 010, κτίριο 9 ςτην Πανεπιςτημιοφπολη (Αιαλάςςα ) Η ςυνάντθςθ διοργανϊκθκε ϊςτε να δοκεί θ ευκαιρία ςτουσ τοπικοφσ κεςμικοφσ παράγοντεσ να παρακολουκιςουν τα αποτελζςματα του ζργου E-WAVE, αλλά να δοκεί και θ ευκαιρία για ςυηιτθςθ των αποτελεςμάτων. τθ ςυνάντθςθ προςκλικθκαν οι φορείσ που δίνονται ςτο Παράρτθμα ΙΙΙ. Ο τελικόσ κατάλογοσ των παρόντων δίνεται ςτο Παράρτθμα ΙΙ. Σο πρόγραμμα τθσ ςυνάντθςθσ δίνεται ςτο Παράρτθμα Ι. Οι εργαςίεσ τθσ ςυνάντθςθσ ξεκίνθςαν με ςφντομο χαιρετιςμό-καλοςϊριςμα από τον ςυντονιςτι του ζργου. τθ ςυνζχεια ακολοφκθςε ενδελεχισ παρουςίαςθ των αποτελεςμάτων κακϊσ και των επιςτθμονικϊν και τεχνικϊν εργαλείων που χρθςιμοποιικθκαν για τθν επιτυχι ολοκλιρωςθ του. Επίςθσ παρουςιάςτθκε θ περιοχι μελζτθσ ςτθν οποία επικεντρϊκθκε το ζργο EWAVE. Αναφζρκθκε ότι ςτισ περιοχζσ δυτικά και νότια τθσ Κφπρου εμφανίηεται το υψθλότερο δυναμικό κυματικισ ενζργειασ, όπωσ διαφάνθκε από τουσ χάρτεσ κυματικισ ενζργειασ που δθμιουργικθκαν ςτα πλαίςια του ζργου. Επιπρόςκετα, ςτον ςφνδεςμο τθσ ιςτοςελίδασ του ζργου E-WAVE είναι διακζςιμθ θ πρόγνωςθ τθσ κυματικισ ενζργειασ ςτθν περιοχι μελζτθσ με τθ βοικεια του ςυςτιματοσ πρόγνωςθ CYCOFOS. Οι δυνατότθτεσ του ςυςτιματοσ CYCOFOS παρουςιάςτθκαν ςτουσ παρευριςκόμενουσ. Μετά τθν ολοκλιρωςθ τθσ παρουςίαςθσ των αποτελεςμάτων ακολοφκθςε ανοικτι ςυηιτθςθ με τουσ παρευριςκόμενουσ. Σα κφρια κζματα ςτα οποία επικεντρϊκθκε θ ςυηιτθςθ ιταν τα ακόλουκα: - H δυνατότθτα αξιοποίθςθσ του εργαλείου πρόγνωςθσ κυματικισ ενζργειασ και από άλλουσ ενδιαφερόμενουσ φορείσ. Ιδιαίτερα όςον αφορά τον Κλάδο Θαλάςςιων Ζργων, θ πρόγνωςθ του φψουσ κφματοσ που περιλαμβάνεται ςτο ςφςτθμα που αναπτφχκθκε είναι ιδιαίτερα χριςιμθ. Επίςθσ, το ίδιο ςφςτθμα μπορεί να παρζχει βραχυπρόκεςμθ και μακρόκεςμθ πρόγνωςθ κυματικϊν χαρακτθριςτικϊν, κακϊσ και δυνατότθτα πρόγνωςθσ ακραίων κυματικϊν φαινομζνων. Το Ζργο ςυγχρηματοδοτείται από την Κυπριακή Δημοκρατία και το Ευρωπαϊκό Ταμείο Περιφερειακήσ Ανάπτυξησ τησ Ε.Ε. ςτα πλαίςια τησ Δζςμησ Προγραμμάτων για Ζρευνα, Τεχνολογική Ανάπτυξη και Καινοτομία , του Ιδρφματοσ Προώθηςησ Ζρευνασ
48 - Δυνατότθτα ςυνεργαςίασ, ανταλλαγισ απόψεων και τεχνογνωςίασ μεταξφ όλων των φορζων που ςυμμετείχαν ςτθ ςυνάντθςθ αλλά και άλλων ενδιαφερόμενων μερϊν. - υγκεκριμζνα, ο εκπρόςωποσ του Κλάδου Θαλάςςιων Ζργων εξζφραςε τθν επικυμία ςυνεργαςίασ του Κλάδου Θαλάςςιων Ζργων Τπουργείο υγκοινωνιϊν & Ζργων με το Ωκεανογραφικό Κζντρο Πανεπιςτθμίου Κφπρου κακϊσ και με τουσ άλλουσ φορείσ του ζργου. Ο εκπρόςωποσ του Κλάδου αναφζρκθκε ςε ςυνθκιςμζνα προβλιματα που αντιμετωπίηει ο Κλάδοσ ςτισ παράκτιεσ περιοχζσ. - Λόγω τθσ διάχυςθσ των αποτελεςμάτων του ζργου E-WAVE, ιδιϊτεσ επενδυτζσ ζχουν εκδθλϊςει το ενδιαφζρον τουσ για επενδφςεισ ςε ζργα κυματικισ ενζργειασ ςτθν Κφπρο. - Επιςθμάνκθκαν ελλείψεισ ςτο κεςμικό πλαίςιο αδειοδότθςθσ ζργων κυματικισ ενζργειασ ςτθν Κφπρο. Oι ςυμμετζχοντεσ ςτθ ςυνάντθςθ ςυμφϊνθςαν ότι θ βελτίωςθ τθσ διαδικαςίασ αδειοδότθςθσ ζργων κυματικισ ενζργειασ ςτθν Κφπρο κα διαδραματίςει καταλυτικό ρόλο ςτθν προϊκθςθ επενδυτικϊν ζργων κυματικισ ενζργειασ. - υηθτικθκαν τεχνικοοικονομικά κζματα για τθν παραγωγι θλεκτρικισ ενζργειασ από τα κφματα. - υηθτικθκαν κζματα διάχυςθσ των αποτελεςμάτων και των δυνατοτιτων του ζργου. υγκεκριμζνα αναφζρκθκαν τρόποι διάχυςθσ των αποτελεςμάτων κακϊσ και οι ομάδεσ ςτισ οποίεσ πρζπει να ςτοχεφςει αυτι. το τζλοσ τθσ ςυνάντθςθσ ηθτικθκε από τουσ παρευριςκόμενουσ να αποςτείλουν τισ κζςεισ τουσ γραπτϊσ. Το Ζργο ςυγχρηματοδοτείται από την Κυπριακή Δημοκρατία και το Ευρωπαϊκό Ταμείο Περιφερειακήσ Ανάπτυξησ τησ Ε.Ε. ςτα πλαίςια τησ Δζςμησ Προγραμμάτων για Ζρευνα, Τεχνολογική Ανάπτυξη και Καινοτομία , του Ιδρφματοσ Προώθηςησ Ζρευνασ
49 ΠΑΡΑΣΗΜΑ Ι Πρόγραμμα υνάντηςησ Παραςκευθ 1 Φεβρουαρίου 2013, ώρα πμ Αίιουςα 010, κτίριο 9 ςτην Πανεπιςτημιοφπολη (Αιαλάςςα ) 10:00 10:05 Καλωςόριςμα από τον Αν. Διευθυντή του Ωκεανογραφικοφ Κζντρου και ςυντονιςτή του E-WAVE Δρ. Γιώργο Ζωδιάτη 10:05 10:35 Παρουςίαςη των αποτελεςμάτων του Έργου E-WAVE Δρ. Γιϊργοσ Γαλάνθσ, Ωκεανογραφικό Κζντρο Πανεπιςτήμιο Κφπρου 10:35-11:30 υηιτθςθ για τα αποτελζςματα και ανταλλαγι απόψεων Το Ζργο ςυγχρηματοδοτείται από την Κυπριακή Δημοκρατία και το Ευρωπαϊκό Ταμείο Περιφερειακήσ Ανάπτυξησ τησ Ε.Ε. ςτα πλαίςια τησ Δζςμησ Προγραμμάτων για Ζρευνα, Τεχνολογική Ανάπτυξη και Καινοτομία , του Ιδρφματοσ Προώθηςησ Ζρευνασ
50 ΠΑΡΑΡΣΗΜΑ ΙΙ Κατάλογοσ παρόντων Σμιμα Πολεοδομίασ και Οικιςεωσ, Τπουργείο Εςωτερικϊν Τπουργείο Εξωτερικϊν Αρχι Λιμζνων Κφπρου Ζνωςθ Κοινοτιτων Κφπρου Ομοςπονδία Περιβαλλοντικϊν Οργανϊςεων Κφπρου Κλάδοσ Θαλαςςίων Ζργων, Τπουργείο υγκοινωνιϊν και Ζργων Σμιμα Ηλεκτρονικϊν Επικοινωνιϊν, Τπουργείο υγκοινωνιϊν και Ζργων Ωκεανογραφικό Κζντρο, Πανεπιςτιμιο Κφπρου Hellenic Naval Academy Μετεωρολογικι Τπθρεςία Κφπρου Ενεργειακό Γραφείο Κυπρίων Πολιτϊν Το Ζργο ςυγχρηματοδοτείται από την Κυπριακή Δημοκρατία και το Ευρωπαϊκό Ταμείο Περιφερειακήσ Ανάπτυξησ τησ Ε.Ε. ςτα πλαίςια τησ Δζςμησ Προγραμμάτων για Ζρευνα, Τεχνολογική Ανάπτυξη και Καινοτομία , του Ιδρφματοσ Προώθηςησ Ζρευνασ
51 Το Ζργο ςυγχρηματοδοτείται από την Κυπριακή Δημοκρατία και το Ευρωπαϊκό Ταμείο Περιφερειακήσ Ανάπτυξησ τησ Ε.Ε. ςτα πλαίςια τησ Δζςμησ Προγραμμάτων για Ζρευνα, Τεχνολογική Ανάπτυξη και Καινοτομία , του Ιδρφματοσ Προώθηςησ Ζρευνασ
52 Το Ζργο ςυγχρηματοδοτείται από την Κυπριακή Δημοκρατία και το Ευρωπαϊκό Ταμείο Περιφερειακήσ Ανάπτυξησ τησ Ε.Ε. ςτα πλαίςια τησ Δζςμησ Προγραμμάτων για Ζρευνα, Τεχνολογική Ανάπτυξη και Καινοτομία , του Ιδρφματοσ Προώθηςησ Ζρευνασ
53 Το Ζργο ςυγχρηματοδοτείται από την Κυπριακή Δημοκρατία και το Ευρωπαϊκό Ταμείο Περιφερειακήσ Ανάπτυξησ τησ Ε.Ε. ςτα πλαίςια τησ Δζςμησ Προγραμμάτων για Ζρευνα, Τεχνολογική Ανάπτυξη και Καινοτομία , του Ιδρφματοσ Προώθηςησ Ζρευνασ
54 ΠΑΡΑΡΣΗΜΑ ΙΙΙ τη ςυνάντηςη αυτθ είχαν προςκληιεί οι ακόλουιοι φορείσ/οργανιςμοί: Πρόεδρο και Μζλθ ΡΑΕΚ Σμιμα Περιβάλλοντοσ, Τπουργείο Γεωργίασ Φυςικϊν Πόρων και Περιβάλλοντοσ Σμιμα Αλιείασ και Θαλαςςίων Ζργων, Τπουργείο Γεωργίασ Φυςικϊν Πόρων και Περιβάλλοντοσ Σμιμα Πολεοδομίασ και Οικιςεωσ, Τπουργείο Εςωτερικϊν Τπθρεςία Ενζργειασ, Τπουργείο Εμπορίου, Βιομθχανίασ και Σουριςμοφ Σμιμα Ηλεκτρομθχανολογικϊν Τπθρεςιϊν, Τπουργείο υγκοινωνιϊν και Ζργων Σμιμα Ηλεκτρονικϊν Επικοινωνιϊν, Τπουργείο υγκοινωνιϊν και Ζργων Μονάδα Θαλαςςίων Ζργων, Τπουργείο υγκοινωνιϊν και Ζργων Σμιμα Εμπορικισ Ναυτιλίασ, Τπουργείο υγκοινωνιϊν και Ζργων Διεφκυνςθσ Ενζργειασ, Θαλάςςιασ Πολιτικισ και Πολιτικοφ χεδιαςμοφ, Τπουργείο Εξωτερικϊν Διεφκυνςθσ Κυπριακοφ και Σουρκικϊν Τποκζςεων, Τπουργείο Εξωτερικϊν Κζντρο υντονιςμοφ Ζρευνασ και Διάςωςθσ Αρχι Λιμζνων Κφπρου Εκτελεςτικό Διευκυντι Δικτφων ΑΗΚ Διαχειριςτι υςτιματοσ Μεταφοράσ Κφπρου (ΔΜ) Επίτροποσ Περιβάλλοντοσ Ζνωςθ Διμων Κφπρου Ζνωςθ Κοινοτιτων Κφπρου Επιςτθμονικό Σεχνικό Επιμελθτιριο Κφπρου (ΕΣΕΚ) Ομοςπονδία Εργοδοτϊν και Βιομθχάνων (ΕΑΠΕΚ) Ομοςπονδία Περιβαλλοντικϊν Οργανϊςεων Κφπρου Το Ζργο ςυγχρηματοδοτείται από την Κυπριακή Δημοκρατία και το Ευρωπαϊκό Ταμείο Περιφερειακήσ Ανάπτυξησ τησ Ε.Ε. ςτα πλαίςια τησ Δζςμησ Προγραμμάτων για Ζρευνα, Τεχνολογική Ανάπτυξη και Καινοτομία , του Ιδρφματοσ Προώθηςησ Ζρευνασ

55 REPUBLIC OF CYPRUS EUROPEAN UNION The National Framework Programme for Research and Technological Development & Innovation is co-funded by the Republic of Cyprus and the European Regional Development Fund ΝEWSLETTER 1 FOR THE Ε-WAVE PROJECT In January 2011 started a major research project on the opportunities for exploitation of wave energy in Cyprus, the E-WAVE project. The project is co-funded by the Republic of Cyprus and the European Regional Development Fund of the EU through the National Framework Programme for Research and Technological Development & Innovation by the Research Promotion Foundation of Cyprus. The E-WAVE project is coordinated by the Oceanographic Centre (University of Cyprus) which is the Lead Partner, while the partners are the National and Kapodistrian University of Athens, the Cyprus Energy Agency, the Ocean Analysis Lab - USA Naval Postgraduate School and the Meteorological Service of Cyprus. The duration of the E-WAVE project is 24 months, so expected to be completed in January The kick off meeting was held on January 26, 2011 in the University of Cyprus. Aim and objectives of the E-WAVE project The aim of the E-WAVE project is the development of an integrated, fully operational high resolution system for monitoring the energy potential from sea waves at the Exclusive Economical Zone (EEZ) of Cyprus and the wider eastern Levantine, coupled with the well established Cyprus Coastal Ocean Forecasting System (CYCOFOS). The new system will include: A complete, high resolution digital atlas containing detailed maps for the coastal and offshore areas of the EEZ of Cyprus in which sea wave and wind climatological characteristics as well as the distribution of the wave energy potential will be monitoring. Novel models for the prediction and quantification of wave energy in short and long forecasts, a tool of significant value for grid designers and regulators. Work Programme of the E-WAVE project The project includes 6 Work Packages (WP) with predetermined starting and ending dates, and each WP includes a concrete number of deliverables. Apart from project management and dissemination activities, in addition, the E-WAVE will implement a new wave model, the development of new computational models for optimization and prediction of wave energy, the functional use of an integrated system and finally the development of wave energy maps in the area. The EWAVE project is co-funded by the Republic of Cyprus and the European regional development fund of the EU through the National Framework Programme for Research and Technological Development & Innovation by the Research Promotion Foundation of Cyprus
, covering the EEZ of Cyprus and the wider eastern Levantine with an extremely high spatial resolution.")
56 Newsletter 1 E-WAVE progress The latest wave model WAM (ECMWF parallel version Cycle 33R1) has been installed in the computer systems of partners. The aim is to simulate the main wave characteristics for a period of ten years ( ), covering the EEZ of Cyprus and the wider eastern Levantine with an extremely high spatial resolution. For processing and scientific visualization of the project E-WAVE, the system LAS (Live Access Server) was installed and used, which follows the standards of the National Oceanic and Atmospheric Administration (NOAA), USA. The website of the E-WAVE project provides useful information for the aim and objectives of the project, the partners, the work packages, the deliverables and the above mentioned LAS system capable of calculating various wave parameters in the study area. Workshop Announcement The E-WAVE consortium will organize an International Workshop on the topic Wave Energy in the Eastern Mediterranean: Quantification and Exploitation aiming at informing the scientific community and all relevant stakeholders on the results of the project E-WAVE, in 9 July 2012 in Cyprus. The workshop is open to the participation of industrial experts, academic researchers, policy makers, regulators etc seeking to highlight the potential exploitation of wave energy in the region. The EWAVE project is co-funded by the Republic of Cyprus and the European regional development fund of the EU through the National Framework Programme for Research and Technological Development & Innovation by the Research Promotion Foundation of Cyprus
57 Newsletter 1 More Information: For more information about the E-WAVE project you may contact the coordinator: Dr George Zodiatis, Vice Director of the Oceanography Centre University of Cyprus Tel: , Fax: , gzodiac@ucy.ac.cy E-WAVE Partners: Oceanography Centre, University of Cyprus Atmospheric Modelling and Weather Forecasting Group, Department of Physics, University of Athens OceananalysisLab USANavalPostgraduateSchool Cyprus Energy Agency Meteorological Service of Cyprus The EWAVE project is co-funded by the Republic of Cyprus and the European regional development fund of the EU through the National Framework Programme for Research and Technological Development & Innovation by the Research Promotion Foundation of Cyprus

58 REPUBLIC OF CYPRUS EUROPEAN UNION The National Framework Programme for Research and Technological Development & Innovation is co-funded by the Republic of Cyprus and the European Regional Development Fund ΝEWSLETTER 2 FOR THE Ε-WAVE PROJECT E-WAVE is a major research project funded by the Research Promotion Foundation of Cyprus and coordinated by the Oceanography Center of the University of Cyprus. The E-WAVE project is coordinated by the Oceanographic Centre (University of Cyprus) which is the Lead Partner, while the partners are the National and Kapodistrian University of Athens, the Cyprus Energy Agency, the Ocean Analysis and Prediction Lab USA Naval Postgraduate School and the Meteorological Service of Cyprus. The project was started on January the 3rd, 2011 and has duration of 24 months. Aim and objectives of the E-WAVE project The aim of the E-WAVE project is the development of an integrated, fully operational high resolution system for monitoring the energy potential from sea waves at the Exclusive Economical Zone (EEZ) of Cyprus and the wider eastern Levantine, coupled with the well established Cyprus Coastal Ocean Forecasting System (CYCOFOS). The new system will include: A complete, high resolution digital atlas containing detailed maps for the coastal and offshore areas of the EEZ of Cyprus in which sea wave and wind climatological characteristics as well as the distribution of the wave energy potential will be monitoring. Novel models for the prediction and quantification of wave energy in short and long forecasts, a tool of significant value for grid designers and regulators. E-WAVE progress On 25 July 2011 a project meeting was held in the Oceanography Center (Univercity of Cyprus). The aim of this meeting was to discuss about the project progress and to present the main results of the simulation regarding the wave characteristics in the study area. The website of the E-WAVE project provides useful information for the aim and objectives of the project, the partners, the work packages, the deliverables and the LAS system (Live Access Server) capable of calculating various wave parameters in the study area. The EWAVE project is co-funded by the Republic of Cyprus and the European regional development fund of the EU through the National Framework Programme for Research and Technological Development & Innovation by the Research Promotion Foundation of Cyprus
59 Newsletter 2 Seminar on August 2011 On August 8, 2011 a seminar with the title E-Wave project: Estimation of the wave energy potential based on numerical wave modeling and statistical techniques was organized by the Oceanography Center of the University of Cyprus and the Greek Naval Academy. The seminar was held in the Naval Postgraduate School in USA and the speaker was Dr. George Galanis. In this seminar, some recent results concerning the wave energy were discussed based on the E-Wave project and another similar project for the energy potential estimation in the Atlantic coastline of Europe. The results of these projects were outlined focusing on the mathematical and physical models that have been utilized. E-Wave Workshop Announcement The E-WAVE consortium will organize an International Workshop on the topic Wave Energy in the Eastern Mediterranean: Quantification and Exploitation aiming at informing the scientific community and all relevant stakeholders on the results of the project E-WAVE. The workshop will take place in Nicosia, Cyprus on 9 July The workshop is open to the participation of industrial experts, academic researchers, policy makers, regulators etc seeking to highlight the potential exploitation of wave energy in the region. For more information and registration please visit the E-Wave Workshop website or refer to the Wave Energy Workshop Announcement in the website of the project. Scientific Publications 1. George Galanis, Dan Hayes, George Zodiatis, P.C. Chu Yu-Heng Kuo and G. Kallos: Wave height characteristics in the Mediterranean Sea by means of numerical modeling, satellite data, statistical and geometrical techniques, Marine Geophysical Research, DOI: /s George Galanis, George Zodiatis, Dan Hayes, Andreas Nikolaidis and George Kallos: CYCOFOS new wave forecasting system incorporating sea currents, European Geosciences Union, Galanis G., Zodiatis G., Hayes D., Nikolaidis A., Georgiou G., Stylianou S., Kallos G., Kalogeri C., Chu P.C., Charalambous A., Savvidou K., Michaelides S: Numerical wave modeling and wave energy estimation, to be presented in the 11th International Conference on Meteorology, Climatology and Atmospheric Physics, Athens George Galanis, George Zodiatis, Dan Hayes, Andreas Nikolaidis, Christina Kalogeri, Alexandros Adam, George Kallos and Georgios Georgiou: Near Shore Wave Modeling and applications to wave energy estimation, to be presented in European Geosciences Union, Galanis G., Zodiatis G., Hayes D., Nikolaidis A., Georgiou G., Stylianou S., Kallos G., Kalogeri C., Chu P.C., Charalambous A., Savvidou K., Michaelides S: The E-WAVE project: Wave energy potential in Cyprus, to be presented in the 10 th Panhellenic Oceanographic and Fisheries Symposium, Athens, 2012 The EWAVE project is co-funded by the Republic of Cyprus and the European regional development fund of the EU through the National Framework Programme for Research and Technological Development & Innovation by the Research Promotion Foundation of Cyprus
60 Newsletter 2 E-WAVE Partners: Oceanography Centre, University of Cyprus Atmospheric Modelling and Weather Forecasting Group, Department of Physics, University of Athens Ocean Analysis and Prediction Lab USA Naval Postgraduate School faculty.nps.edu/pcchu/noap_home.htm Cyprus Energy Agency Meteorological Service of Cyprus More Information: For more information about the E-WAVE project you may contact the E-WAVE coordinator: Dr George Zodiatis, Vice Director of the Oceanography Centre, University of Cyprus, Tel: , Fax: , gzodiac@ucy.ac.cy The EWAVE project is co-funded by the Republic of Cyprus and the European regional development fund of the EU through the National Framework Programme for Research and Technological Development & Innovation by the Research Promotion Foundation of Cyprus

61 REPUBLIC OF CYPRUS EUROPEAN UNION The National Framework Programme for Research and Technological Development & Innovation is co-funded by the Republic of Cyprus and the European Regional Development Fund ΝEWSLETTER 3 FOR THE Ε-WAVE PROJECT E-WAVE is a major research project funded by the Research Promotion Foundation of Cyprus and coordinated by the Oceanography Center of the University of Cyprus. The E-WAVE partners are the National and Kapodistrian University of Athens, the Cyprus Energy Agency, the Ocean Analysis and Prediction Lab USA Naval Postgraduate School and the Meteorological Service of Cyprus. The project was started on January the 3rd, 2011 and has duration of 24 months. However, the project will be officially finished on 2 April 2013, after an extension provided by the Research Promotion Foundation of Cyprus. Aim and objectives of the E-WAVE project The aim of the E-WAVE project is the development of an integrated, fully operational high resolution system for monitoring the energy potential from sea waves at the Exclusive Economical Zone (EEZ) of Cyprus and the wider eastern Levantine, coupled with the well established Cyprus Coastal Ocean Forecasting System (CYCOFOS). The new system will include: A complete, high resolution digital atlas containing detailed maps for the coastal and offshore areas of the EEZ of Cyprus in which sea wave and wind climatological characteristics as well as the distribution of the wave energy potential will be monitoring. Novel models for the prediction and quantification of wave energy in short and long forecasts, a tool of significant value for grid designers and regulators. The EWAVE project is co-funded by the Republic of Cyprus and the European regional development fund of the EU through the National Framework Programme for Research and Technological Development & Innovation by the Research Promotion Foundation of Cyprus

62 Newsletter 3 Main results of the project Ε-WAVE The two main parameters that determine the wave energy potential (wave height and wave period) are relatively high in the west and south sea area of Cyprus. This area is characterized by long-period waves (swell) and with a mean wave period more than 5 seconds: In the same area, a high energy potential has been estimated and relatively low values of the standard deviation of wave energy potential: The estimated wave energy potential in the south-west sea area of Cyprus is quite lower than the corresponding potential of the north coast of Europe, where a great mobility on wave energy is encountered. However, the available energy potential in this area is exploitable having small percentage of uncertainty-deviation, a fact of great for future investments in the field of energy production from waves with an appropriate design and sizing. The EWAVE project is co-funded by the Republic of Cyprus and the European regional development fund of the EU through the National Framework Programme for Research and Technological Development & Innovation by the Research Promotion Foundation of Cyprus

63 Newsletter 3 Local Actors Meeting On 1 st of February 2013 the Local Actors Meeting was held in Nicosia, in the framework of the E-WAVE project. The aim of the meeting was to inform the local actors about the results of the project and to carry out a discussion about the results of the project. Apart from the project consortium, the Local Actors Meeting was attended by representatives from the Department of Town Planning and Housing, Ministry of the Interior, Ministry of Foreign Affairs of the Republic of Cyprus, the Cyprus Ports Authority, the Union of Cyprus Communities, the Cyprus Federation of Environmental and Ecological Organizations, the Department of Electronic Communications, the Ministry of Communications and Works and the Department of Marine Works. One major result concluded from the discussion between the participants was that the results and tools developed within the framework of the project E-WAVE should be extensively utilized and disseminated by several organizations in Cyprus. Furthermore, all the participants agreed that in Cyprus there should be established a powerful collaboration between all the interest parts in the field of wave energy. E-WAVE website The website of the E-WAVE project provides useful information for the aim, the objectives and results of the project, the partners, the work packages, the deliverables and the LAS analysis and visualization system (Live Access Server) which is capable of calculating various wave parameters in the study area. The EWAVE project is co-funded by the Republic of Cyprus and the European regional development fund of the EU through the National Framework Programme for Research and Technological Development & Innovation by the Research Promotion Foundation of Cyprus


64 Newsletter 3 Access to the results of the project E-WAVE If you would like to access the results of the EWAVE project please send an to andriak@ucy.ac.cy stating your name, company details, work address, and purpose of use of the data. Operational forecast of wave power The model of online/operational forecast of wave power potential in the EEZ of Cyprus and in the general area of Levantine, developed within the framework of the Ewave project, has been included in the CYCOFOS forecasting system and is available online at. Other useful links Cyprus Coastal Ocean Forecasting and Observing System (CYCOFOS) The BLUE OCEAN ENERGY project Scientific Publications 1. George Galanis, Dan Hayes, George Zodiatis, P.C. Chu Yu-Heng Kuo and G. Kallos: Wave height characteristics in the Mediterranean Sea by means of numerical modeling, satellite data, statistical and geometrical techniques, Marine Geophysical Research, DOI: /s The EWAVE project is co-funded by the Republic of Cyprus and the European regional development fund of the EU through the National Framework Programme for Research and Technological Development & Innovation by the Research Promotion Foundation of Cyprus
65 Newsletter 3 2. George Galanis, George Zodiatis, Dan Hayes, Andreas Nikolaidis and George Kallos: CYCOFOS new wave forecasting system incorporating sea currents, European Geosciences Union, Galanis G., Zodiatis G., Hayes D., Nikolaidis A., Georgiou G., Stylianou S., Kallos G., Kalogeri C., Chu P.C., Charalambous A., Savvidou K., Michaelides S: Numerical wave modeling and wave energy estimation, to be presented in the 11th International Conference on Meteorology, Climatology and Atmospheric Physics, Athens George Galanis, George Zodiatis, Dan Hayes, Andreas Nikolaidis, Christina Kalogeri, Alexandros Adam, George Kallos and Georgios Georgiou: Near Shore Wave Modeling and applications to wave energy estimation, European Geosciences Union, Galanis G., Zodiatis G., Hayes D., Nikolaidis A., Georgiou G., Stylianou S., Kallos G., Kalogeri C., Chu P.C., Charalambous A., Savvidou K., Michaelides S: The E- WAVE project: Wave energy potential in Cyprus, 10 th Panhellenic Oceanographic and Fisheries Symposium, Athens, G. Zodiatis, D. Hayes, A. Karaolia, S. Stylianou, A. Nikolaidis, I. Constantinou, S. Michael, G. Galanis and G. Georgiou, Technologies for Online Data Management of Oceanographic Data, Geophysical Research Abstracts, Vol. 14, EGU , 2012, EGU General Assembly Zodiatis G., Galanis G., Hayes D., Nikolaidis A., Georgiou G., Stylianou S., Kallos G., Kalogeri C., Chu P.C., Charalambous A., Savvidou K., Kountouriotis Z., Michaelides S., Estimation and monitoring of the wave energy potential in Cyprus, 4th International Meeting on Meteorology and Climatology of the Mediterranean, Roussillon, France,2013 The EWAVE project is co-funded by the Republic of Cyprus and the European regional development fund of the EU through the National Framework Programme for Research and Technological Development & Innovation by the Research Promotion Foundation of Cyprus
66 Newsletter 3 E-WAVE Partners: Oceanography Centre, University of Cyprus Atmospheric Modelling and Weather Forecasting Group, Department of Physics, University of Athens Ocean Analysis and Prediction Lab USA Naval Postgraduate School faculty.nps.edu/pcchu/noap_home.htm Cyprus Energy Agency Meteorological Service of Cyprus More Information: For more information about the E-WAVE project you may contact the E-WAVE coordinator: Dr George Zodiatis, Vice Director of the Oceanography Centre, University of Cyprus, Tel: , Fax: , gzodiac@ucy.ac.cy, The EWAVE project is co-funded by the Republic of Cyprus and the European regional development fund of the EU through the National Framework Programme for Research and Technological Development & Innovation by the Research Promotion Foundation of Cyprus
67 Stoch Environ Res Risk Assess (2012) 26: DOI /s ORIGINAL PAPER Wave height characteristics in the north Atlantic ocean: a new approach based on statistical and geometrical techniques George Galanis Peter C. Chu George Kallos Yu-Heng Kuo C. T. J. Dodson Published online: 20 November 2011 Ó Springer-Verlag 2011 Abstract The main characteristics of the significant wave height in an area of increased interest, the north Atlantic ocean, are studied based on satellite records and corresponding simulations obtained from the numerical wave prediction model WAM. The two data sets are analyzed by means of a variety of statistical measures mainly focusing on the distributions that they form. Moreover, new techniques for the estimation and minimization of the discrepancies between the observed and modeled values are proposed based on ideas and methodologies from a relatively new branch of mathematics, information geometry. The results obtained prove that the modeled values overestimate the corresponding observations through the whole study period. On the other hand, 2-parameter Weibull distributions fit well the data in the study. However, one cannot use the same probability density function for describing the whole study area since the corresponding scale and shape parameters deviate significantly for points belonging to G. Galanis (&) Section of Mathematics, Hellenic Naval Academy, Xatzikyriakion, Piraeus, Greece ggalanis@mg.uoa.gr G. Galanis G. Kallos Division of Environmental Physics-Meteorology, Atmospheric Modeling and Weather Forecasting Group, University of Athens, School of Physics, University Campus, Bldg. PHYS-V, Athens, Greece P. C. Chu Y.-H. Kuo Department of Oceanography, Graduate School of Engineering & Applied Science, Naval Postgraduate School, Monterey, CA 93943, USA C. T. J. Dodson School of Mathematics, Manchester University, Manchester M13 9PL, UK different regions. This variation should be taken into account in optimization or assimilation procedures, which is possible by means of information geometry techniques. Keywords Numerical wave prediction models Distribution of significant wave height Radar altimetry Information geometry Fisher information metric 1 Introduction In a demanding scientific and operational environment, the validity of high quality sea state information is constantly increasing. This is in direct correspondence with the significant number of applications that are affected: climate change, transportation, marine pollution, wave energy production and ship safety can be listed among them. One of the most credible approaches towards accurate sea state forecasting products is the use of numerical wave prediction systems in combination with atmospheric models (see, e.g., WAMDIG 1988; Lionello et al. 1992; Komen et al. 1994; Chu and Cheng 2008). Such systems have been proved successful for the simulation of the general sea state conditions on global or intermediate scale. However, when focusing on local characteristics usually systematic errors appear (see Janssen et al. 1987; Chu et al. 2004; Chu and Cheng 2007; Makarynskyy 2004, 2005; Greenslade and Young 2005; Galanis et al. 2006, 2009; Emmanouil et al. 2007). This is a multi-parametric problem in which several different issues are involved: The strong dependence of wave models on the corresponding wind input, the inability to capture sub-scale phenomena, the parametrization of certain wave properties especially in areas with complicated coastal formation where overshadowing and inaccurate refraction wave features emerge, as well as the lack of 123
68 84 Stoch Environ Res Risk Assess (2012) 26: a dense observation network which, as in the case of atmospheric parameters over land, could help on the systematic correction of initial conditions. The latter increases the added value of satellite records for ocean wave parameters. Within this framework, there are two main ways that the research community followed over the last few years in order to minimize the effects of the above mentioned difficulties: Assimilating available observations in order to improve the initial conditions (Janssen et al. 1987; Breivik and Reistad 1994; Lionello et al. 1992, 1995; Abdalla et al. 2005; Emmanouil et al. 2007) and optimization of the direct model outputs by using statistical techniques like artificial neural networks (Makarynskyy 2004, 2005), MOS methods, Kalman filters, etc. (Kalman 1960; Kalman and Bucy 1961; Rao et al. 1997; Galanis and Anadranistakis 2002; Kalnay 2002; Galanis et al. 2006, 2009). In both cases the main idea is the minimization of a costfunction that governs the evolution of the error. Similar approaches are also adopted in purely statistical models used for the estimation of wave height (see, for example, Vanem 2011; Vanem et al. 2011). At this point a critical simplification is usually made: The distance between observed and modeled values or distributions is measured by means of classical Euclidean geometry tools using, for example, least square methods. This is, however, not always correct. Recent advances, in particular the rapid development of information geometry, suggest that the distributions are elements of more complicated structures, non Euclidean in general. More precisely, distributions of the same type form a manifold, which is the generalization of a Euclidean space and in which the underlying geometry may differ significantly from the classical one (see Amari 1985; Amari and Nagaoka 2000; Arwini and Dodson 2007, 2008). The exact knowledge of the framework in which the data sets or distributions under consideration are classified may give more accurate criteria and procedures for the optimization of the final results. The purpose of the present work is twofold: At first, the sea state characteristics in the north Atlantic ocean are analyzed by means of a variety of statistical indices. Special attention is given to the probability distribution function of the significant wave height (the average height of the highest one-third waves in a wave spectrum). In a second step, the derived statistical information is utilized for the estimation of possible biases in numerical wave predictions based on novel techniques provided in the framework of information geometry. For the above purposes simulated wave data obtained from the state-of-the art numerical WAve prediction Model (WAM) (Komen et al. 1994; WAMDIG 1988; Jansen 2000, Bidlot and Janssen 2003) and corresponding records from all the available satellites covering the study area (Radar Altimetry Tutorial project, Rosmorduc et al. 2009) are employed. The distributions that the two data sets form are recovered based on different statistical tests, and intercomparisons are attempted. An application of the proposed methodology is outlined by focusing on a restricted area (northwestern coastline of France and Spain) avoiding lumping data from different wave climate regions. Alternative scenarios for the estimation of model biases are discussed. The results and ideas presented in this work could be exploited for designing and using new methods for the optimization of the initial conditions and the final outputs of numerical wave prediction systems since they could support more sophisticated ways of realizing the corresponding cost functions taking into account the geometric properties (scale and shape parameters for example) of the space that the data under study form, and avoiding simplifications that the classical pattern (least square methods) impose. The presented material is organized as follows: In Sect. 2 the wave model, the data sets and the methodology used are described. The statistical results obtained for the observations and the corresponding modeled values are analyzed in Sect. 3. In particular, Sect. 3.1 focuses on the optimum choice of distributions that fit to the data in the study, while in Sect. 3.2 a detailed study of the results obtained in a restricted area (northwestern coastline of Spain and France) is presented based on descriptive statistics and distribution fitting. In Sect. 4 a new approach dealing with the problem of distance estimation between observations and modeled values is proposed by using techniques of information geometry. Section 4.1 is devoted to the introduction of some general notions and results while in Sect. 4.2 a direct application to the wave data in the study is attempted. Finally, the main conclusions of this work are summarized in Sect Models, data sets and methodology 2.1 The wave model The model used for wave simulation is WAM Cycle 4 ECMWF version (Jansen 2000; Bidlot and Janssen 2003). This is a third generation wave model which solves the wave transport equation explicitly without any assumptions on the shape of the wave spectrum (WAMDIG 1988; Komen et al. 1994). The model was operated by our group (Atmospheric Modeling and Weather Forecasting Group, University of Athens, in an operational/forecasting mode (that is using forecasted wind forcing and not reanalysis data) for a period of 12 months (year 2008) covering the north Atlantic ocean (Latitude 0 N 80 N, Longitude 100 W 30 E, Fig. 1). The wave spectrum was discretized to 30 frequencies (range Hz logarithmically spaced) and 24 directions (equally spaced). 123

69 Stoch Environ Res Risk Assess (2012) 26: Fig. 1 The study area. The red rectangle denotes the borders of the restricted region. (Color figure online) The horizontal resolution used was and the propagation time step 300 s. WAM, ran on a deep water mode with no refraction, driven by 6-hourly wind input (10 m above sea level winds speed and direction) obtained by NCEP/GFS global model with horizontal grid resolution It should be noted that no assimilation procedure was employed since the available satellite data are used in our study as independent observations against which the modeled values are evaluated. 2.2 The satellite data The observation data used in this study are obtained from the ESA-CNES joint project Radar Altimetry Tutorial (Rosmorduc et al. 2009). These data contain near-real time gridded observations for significant wave height obtained by merging all available relevant satellite records from official data centers: ERS-1 and ERS-2 (ESA), Topex/Poseidon (NASA/CNES), Geosat Follow-On (US Navy), Jason-1 (CNES/NASA), Envisat (ESA). The system is running daily in an operational mode. Each run is based on the available satellite data of the previous 2 days from which a merged map is generated. The produced interpolated outputs cover the whole area of study (0 N 80 N, 100 W 30 E) at a resolution of Data are cross-calibrated and quality controlled using Jason-1 as reference mission. The results are improved in case of additional mission availability. The period covered is again the whole year Statistical approaches methodology Both observations and wave modeled data are studied by two statistical points of view: The first is based on descriptive statistical analysis methods where conventional indices are employed in order to capture the basic aspects of the data evolution spatially and temporally. The second approach is based on the study of the probability density function that fits to the available data. This is a complementary approach being able to provide additional information for the shape and scale of the data in the study including possible impact of extreme values. In this way, a complete view of the main characteristics of observational and simulated significant wave height values is obtained. More precisely, the following statistical measures are used: Mean value of available data: Mean ¼ l ¼ 1 N X N i¼1 SWHðÞ i Here SWH denotes the recorded (observed) or simulated significant wave height value and N the size of the sample. qffiffiffiffiffiffiffiffiffiffiffiffiffiffiffiffiffiffiffiffiffiffiffiffiffiffiffiffiffiffiffiffiffiffiffiffiffiffiffiffiffiffiffiffi P 1 Standard deviation: r ¼ N N i¼1 ðswhðþ l i Þ2 Coefficient of variation: c v ¼ r l ; a normalized measure of the dispersion. Skewness: P 1 N N i¼1 g 1 ¼ ðswhðþ l i Þ3 r 3 a measure of the asymmetry of the probability distribution. Kurtosis: P 1 N N i¼1 g 2 ¼ ðswhðþ l i Þ4 r
70 86 Stoch Environ Res Risk Assess (2012) 26: that gives a measure of the peakedness of the probability distribution. Additionally, the basic percentiles (P 5, P 10, P 25 = Q 1, P 50 = median, P 75 = Q 3,P 90 and P 95 ) are used. Apart from the above descriptive statistical approach, the data in the study have been analyzed by a distributional point of view. More precisely, the optimum probability density functions (pdfs) that fit the observational and modeled significant wave height series are revealed. A variety of pdfs have been tested (Logistic, Normal, Gamma, Log-Gamma, Log-Logistic, Lognormal, Weibull, Generalized Logistic) at several levels of statistical significance by utilizing different fitting tests (Kolmogorov Smirnov, Anderson Darling as well as P P and Q Q plots) as well as statistical tools: Matlab ( com/products/matlab/) and EasyFit ( com/). The results reconfirm previous studies (Nordenstrøm 1973; Thornton and Guza 1983; Ferreira and Soares 1999, 2000; Prevosto et al. 2000; Muraleedharan et al. 2007; Gonzalez-Marco et al. 2008) proposing the Weibull distribution as a very good choice for fitting significant wave height data (see for example Fig. 2). However, the scale and shape parameters obtained vary spatially and temporarily (Sect. 3.1). Apart from the above-mentioned classical statistical approaches, one of the main novelties proposed in this work is the utilization of non conventional statistical techniques obtained from a relatively new branch of Mathematics, the information geometry. This approach, discussed in detail in Sect. 4, allows the accurate description of the space to which the results under study belong and, based on the corresponding geometric properties, the better estimation of possible biasses. In this way, one avoids a classical simplification adopted in conventional statistics: the calculation of distances based on Euclidean measures. 3 Results and statistics 3.1 Probability density Function fitting The data obtained for the significant wave height in the north Atlantic ocean, as simulated by the wave model (Sect. 2.1) and recorded by the Radar Altimetry Tool (Sect. 2.2), are studied here focusing on the distributions that they form. The use of all the statistical fitting tests mentioned earlier verified that, in most of the cases, the two-parameter Weibull distribution: f ðxþ ¼ a x ða 1Þ e ðþ x a b ; a; b [ 0; b b where a is the shape and b the scale parameter, fits well to the wave data at a statistical significance level of 0.05 or higher. An example is presented in Fig. 2. However, different parameters are obtained for the pdfs of satellite records and WAM values. On the other hand, a non-trivial spatial variability is revealed. It should be noticed that the 3-parameter Weibull distribution fits also to the data in the study but with trivial differences from the 2-parameter case. Since an additional parameter would result in far more technical calculations in the proposed information geometry methodology without providing essential improvement of the obtained techniques, the 2-parameter Weibull has been adopted. The data sets were partitioned into 3-monthly intervals (December February, March May, June August and Fig. 2 Fitting of the 2-parameter Weibull distribution to the WAM modeled significant wave height data for May
71 Stoch Environ Res Risk Assess (2012) 26: September November) in order to have a clearer view of the seasonal variability of the sea state. In Figs. 3, 4, 5, and 6 the shape parameter of the obtained Weibull distribution fitted to the satellite data is plotted over the whole area of interest while Figs. 7, 8, 9, and 10 contain the corresponding values for the WAM outputs. It is worth underlining here that in both cases the values estimated are clearly increasing towards offshore areas. In particular, the maximum values emerged at the region southeast of Greenland and south of Iceland reaching values of 6.5 during the winter period (Figs. 3, 7). For the rest of the period, the same area keeps the maximum estimated values which, however, are significantly decreased. It is also noticeable that the estimated shape parameters for WAM outputs are elevated compared to those of satellite records in a relatively mild but systematic way. The Weibull scale parameter values are presented in Figs. 11, 12, 13, and 14 for satellite records and Figs. 15, 16, 17, and 18 for their WAM counterparts. The wave model in this case seems to yield, in general, underestimated values. On the other hand, the increased values at the southern part of the domain, especially during summer months, can be partially attributed to the non uniform distribution of wave heights in this area. It is important to underline at this point that the significant spatial variation of both shape and scale parameters, revealed in all the above cases, indicates that considering uniform ways of studying or correcting wave heights over Fig. 3 The shape parameter of the Weibull distributions that fit to the significant wave height satellite data over the north Atlantic ocean for the months December February Fig. 4 The shape parameter of the Weibull distributions that fit to the significant wave height satellite data over the north Atlantic ocean for the months March May 123
72 88 Stoch Environ Res Risk Assess (2012) 26: Fig. 5 The shape parameter of the Weibull distributions that fit to the significant wave height satellite data over the north Atlantic ocean for the months June August Fig. 6 The shape parameter of the Weibull distributions that fit to the significant wave height satellite data over the north Atlantic ocean for the months September November the whole Atlantic ocean is an assumption of increased risk. 3.2 Focusing on a restricted area In this section, the attention is focused on a restricted area of increased interest due to several activities raised recently concerning mainly wave energy applications: the northwest coastline of France and Spain (inner rectangle in Fig. 1). Indeed, several European and national projects require the exact knowledge of the local wave climate as well as the accurate sea state prediction in order to estimate the available energy potential. The sea wave characteristics are studied here by two different points of view: Descriptive statistical measures, giving the main information for the data in the study, as well as distribution fitting in order to categorize them in a more uniform way, appropriate for the new techniques proposed in this work. In Table 1 the main descriptive statistical indices, as described in Sect. 2.3, are presented in monthly intervals for the available satellite data. The time period covered is again the year 2008 and the sample size exceeds 2 million values. The corresponding results for the whole time period as well as divided in Summer (April September) and Winter months (October March) can be found in Table 2. The first conclusions are rather expected: The range of the observations as well as their mean value and variability are higher during winter. Furthermore, the increased kurtosis during March and May reveals that a 123


73 Stoch Environ Res Risk Assess (2012) 26: Fig. 7 The shape parameter of the Weibull distributions that fit to the WAM modeled significant wave height over the north Atlantic ocean for the months December February Fig. 8 The shape parameter of the Weibull distributions that fit to the WAM modeled significant wave height over the north Atlantic ocean for the months March May significant part of the variability is related to non frequent outliers. The percentiles of the satellite records are presented in Tables 3 and 4. The corresponding statistics for WAM outputs are presented in Tables 5, 6, 7, and 8. The basic descriptive statistical measures can be found in Tables 5 and 6 while the corresponding percentiles are presented in Tables 7 and 8. The same results are graphically represented in Figs. 19, 20, 21, and 22. Interesting conclusions can be stated here for the accuracy of the numerical wave model WAM in an open sea area: WAM slightly, but constantly, overestimates wave heights through the whole study period (Fig. 19). The time independence of this divergence is worth mentioning. The variability of both observations and modeled values is increased during winter, something expected due to the unstable weather conditions. What needs to be mentioned is the consistently, again, higher values of the standard deviation of WAM (Fig. 20). Significant discrepancies exist between the ranges of the wave height results in the two sets (WAM simulations and satellite observations). This can be, at least partly, attributed to the fact that the observation data set is obtained by merging different satellite measurements, a procedure that always includes some smoothness of the final results due to interpolation. On the other hand, the well known difficulties of WAM on successfully simulating the swell decay (WISE Group 2007) contribute also to this problem. 123

74 90 Stoch Environ Res Risk Assess (2012) 26: Fig. 9 The shape parameter of the Weibull distributions that fit to the WAM modeled significant wave height over the north Atlantic ocean for the months June August Fig. 10 The shape parameter of the Weibull distributions that fit to the WAM modeled significant wave height over the north Atlantic ocean for the months September November The relatively higher values of the corresponding percentiles as well as the monotonic increased distances between them (Tables 3, 4, 7, 8) confirm the overestimation of the data by WAM simulations and the non negligible influence of extreme values to their distribution. Although the purpose of this work is not to concentrate on problems of the wind/wave models that may lead to such deviations, it should be noted that the latter are closely related to the wind input used (atmospheric models discrepancies). On the other hand, the inclusion of current in wave forecasting is still lacking in WAM, while problems with the accurate simulation of the swell waves and especially their decay, as already mentioned earlier, also contribute to these discrepancies. It is worth noticing at this point that when wind sea and swell components are considered, a spectral partitioning adopted will affect the accuracy of wind sea and swell statistics. The Hanson and Phillips formulation (developed by the Applied Physics Department of Johns Hopkins University, 2001) for labeling wind sea and swell is commonly applied. The main drawback of this approach is related to fully developed wind seas with a small wind decay but still in the same direction of the wave field, as shown by Quentin (2002), and later by Loffredo et al. (2009); if the new condition cannot satisfy the formulation adopted by Hanson and Phillips, the old wind sea will be treated as swell and the new wind sea set to zero. Further, as documented in Loffredo et al. (2009), 123


75 Stoch Environ Res Risk Assess (2012) 26: Fig. 11 The scale parameter of the Weibull distributions that fit to the significant wave height satellite data over the north Atlantic ocean for the months December February Fig. 12 The scale parameter of the Weibull distributions that fit to the significant wave height satellite data over the north Atlantic ocean for the months March May the Hanson and Phillips formulation for labeling wind sea and swell may increase the number of wind seas as compared to other commonly used approaches for partitioning of wind sea and swell. Skewness is increased in WAM outputs compared to the observations (Fig. 21). This higher positive asymmetry indicates that a non-negligible portion of the modeled significant wave height is concentrated to relatively smaller values something that is less obvious in the corresponding observations. Elevated kurtosis for WAM outputs can be attributed to the increased influence of extreme values. This situation is more obvious during March and the summer months (Fig. 22). Studying now the same data from a distribution fitting point of view, following the methodology discussed in Sect. 3.1, the following points may be emphasized: The 2-parameter Weibull distribution seems to fit well to the data in the study both for WAM and observed values. The shape parameter (a) both for the recorded and simulated values of SWH seems to deviate from the case of Rayleigh distribution (Tables 9, 10, 11, 12; Fig. 23) where a = 2. The latter was the pdf proposed in previous works (e.g., Muraleedharan et al. 2007) indicating that the use of the general 2-parameter Weibull probability density function is more appropriate. 123

 for WAM (Fig. 24) reconfirms the overestimation of modeled values as already noticed based on the descriptive statistical measures.")
76 92 Stoch Environ Res Risk Assess (2012) 26: Fig. 13 The scale parameter of the Weibull distributions that fit to the significant wave height satellite data over the north Atlantic ocean for the months June August Fig. 14 The scale parameter of the Weibull distributions that fit to the significant wave height satellite data over the north Atlantic ocean for the months September November The increased values of the scale parameter (b) for WAM (Fig. 24) reconfirms the overestimation of modeled values as already noticed based on the descriptive statistical measures. Moreover, the values of b for both cases follow the pattern of the mean values being reduced during summer months. The discrepancies between the parameters of the Weibull distributions obtained for satellite records and modeled wave height values are not major. Therefore, the techniques described in Sect for estimating the distance between WAM outputs and the corresponding observations can be exploited. 4 Estimation of the distance between observations and simulated values using information geometrical techniques In the previous sections special attention was given on the main statistical characteristics as well as the distributions formed by WAM values and the corresponding satellite records for the area of the north Atlantic ocean. The obtained results reveal non negligible differences between the two data sets that should be taken into consideration in order to optimize the accuracy of the wave model. Some new ideas towards this direction based on information 123


77 Stoch Environ Res Risk Assess (2012) 26: Fig. 15 The scale parameter of the Weibull distributions that fit to the WAM modeled significant wave height over the north Atlantic ocean for the months December February Fig. 16 The scale parameter of the Weibull distributions that fit to the WAM modeled significant wave height over the north Atlantic ocean for the months March May geometry (IG) techniques are discussed in the present work. More precisely, having already defined the best-fitting distributions to the data in the study, a detailed description of the space that they form is attempted, the corresponding geometric entities are investigated and new techniques are proposed for the accurate estimation of the distance between observations and modeled values. 4.1 Basic information geometric concepts In order to make this work as self-contained as possible, a short presentation of the main notions and terminology of information geometric techniques needed here follows. More details and results can be found in Amari 1985; Amari and Nagaoka 2000; Arwini and Dodson 2007, Information geometry is a relatively new branch of mathematics in which the main idea is to apply methods and techniques of non-euclidean geometry to probability theory and stochastic processes. In particular, information geometry realizes a smoothly parametrized family of probability distributions as a manifold on which geometrical entities such as Riemannian metrics, distances, curvature and affine connections can be introduced. To be more precise, a family of probability distributions S ¼ fp n ¼ px; ð nþjn ¼ ½n 1 ; n 2 ;...; n n Š 2 Ng ð1þ 123


78 94 Stoch Environ Res Risk Assess (2012) 26: Fig. 17 The scale parameter of the Weibull distributions that fit to the WAM modeled significant wave height over the north Atlantic ocean for the months June August Fig. 18 The scale parameter of the Weibull distributions that fit to the WAM modeled significant wave height over the north Atlantic ocean for the months September November Table 1 The main statistical parameters for satellite data in the restricted area per month Statistical parameter Jan Feb Mar Apr May Jun Jul Aug Sep Oct Nov Dec Range Mean Std. deviation Coef. of variation Skewness Kurtosis where each element may be parametrized using the n real valued variables ½n 1 ; n 2 ;...; n n Š in an open subset N of R n while the mapping n! p n is injective and smooth, is called a n-dimensional statistical manifold. The geometrical entities in a statistical manifold are dependent on the Fisher information matrix which at a point n is a n 9 n matrix 123
79 Stoch Environ Res Risk Assess (2012) 26: Table 2 The main statistical parameters for satellite data in the restricted area summarized for the whole study period, the summer and winter months Statistical parameter Overall Summer Winter Range Mean Std. deviation Coef. of variation Skewness Kurtosis GðÞ¼ n g ij ðnþ ; ð2þ defined by g ij ðnþ ¼ E xjn o i ðx; nþo j ðx; nþ Z ¼ o i ðx; nþo j ðx; nþpx; ð nþdx; i; j ¼ 1; 2;...; n: ð3þ Here o i stands for the partial derivative with respect to the i-th factor, is the log-likelihood function: ðx; nþ ¼ n ðþ¼log x ½px; ð nþš ð4þ and E xjn ½f Š ¼ Z fðþpx; x ð nþdx ð5þ denotes the expectation with respect to the distribution p. The matrix GðnÞ is always symmetric and positive semidefinite (Amari and Nagaoka 2000). If, in addition, GðnÞ is positive definite, then a Riemannian metric (see Spivak 1965, 1979; Dodson and Poston 1991) can be defined on the statistical manifold corresponding to the inner product induced by the Fisher information matrix on the natural basis of the coordinate system ½n i Š: g ij ¼ o i jo j : ð6þ This Riemannian metric is called the Fisher metric or the information metric. The corresponding geometric properties of this framework are characterized by the so-called Christoffel symbols defined by the relations: C i jk Table 4 Percentiles for satellite data in the restricted area for the whole study period, the summer and winter months Percentile Overall Summer Winter P P P 25 = Q P 50 (median) P 75 = Q P P C jk;h ðnþ ¼ E n o j o k n þ 1 2 o j n o k n ðo h n Þ ; C jk;h ¼ X2 i¼1 i; j ; h ¼ 1; 2;...; n; ð7þ g hi C i jkð h ¼ 1; 2 Þ: ð8þ The minimum distance between two elements f 1 and f 2 of a statistical manifold S is defined by the corresponding geodesic x which is the minimum length curve that connects them. Such a curve x ¼ ðx i Þ : R! S ð9þ satisfies the following system of 2nd order differential equations: x 00 i ðþþ t Xn j;k¼1 C i jk ðþx0 t jðþx t 0 kðþ¼0; t i ¼ 1; 2;...; n: ð10þ under the conditions xð0þ ¼ f 1 ; xð1þ ¼ f 2. It worth noticing that information geometric techniques have been, directly or not, tested on different applications. Iguzquiza and Chica-Olmo (2008), for example, utilized the Fisher information matrix for geostatistical simulations for restricted samples. On the other hand, Cai et al. (2002) applied information theoretic analysis on self-clustering of amino acids along protein chains. Resconi (2009) is also based on non-euclidean geometric tools for a risk analysis study. However, to the author s knowledge, the current work is the first try to apply such tools on meteorology/ oceanography. Table 3 Percentiles for satellite data in the restricted area per month Percentile Jan Feb Mar Apr May Jun Jul Aug Sep Oct Nov Dec P P P 25 = Q P 50 (median) P 75 = Q P P
80 96 Stoch Environ Res Risk Assess (2012) 26: Table 5 The main statistical parameters for WAM outputs in the restricted area per month Statistical parameter Jan Feb Mar Apr May Jun Jul Aug Sep Oct Nov Dec Range Mean Std. deviation Coef. of variation Skewness Kurtosis Table 6 The main statistical parameters for WAM outputs in the restricted area summarized for the whole study period, the summer and winter months Statistical parameter Overall Summer Winter Range Mean Std. deviation Coef. of variation Skewness Kurtosis Table 8 Percentiles for WAM outputs in the restricted area for the whole study period, the summer and winter months Percentile Overall Summer Winter P P P 25 = Q P 50 (median) P 75 = Q P P Application to WAM outputs and satellite data The significant wave height data obtained in the present study, both from satellite records and WAM model, have been proved in Sect. 3.1 to follow 2-parameter Weibull distributions. The corresponding parameters however seem to differ between the two data sets and to fluctuate in time and space. In this section different scenarios will be discussed, based on information geometric techniques, concerning the optimum way of estimating the distance between the two data sets. The obtained results can be exploited in assimilation or optimization procedures for better defining the involving cost functions targeting at the improvement of the final modeled products. Following the formalism presented in Sect. 4.1, the family of the two parameter Weibull distributions can be considered as a 2-dimensional statistical manifold with n = [a, b], N = {[a, b]; a and b [ 0} and px; ð nþ ¼ a x a 1 e ðþ x a b b b The log-likelihood function becomes: ðx; n ÞÞ ¼ log½px; ð nþš ¼ log a log b þ ða 1Þðlog x log bþ x b ð11þ a ð12þ while the Fisher information matrix (Amari 1985; Amari and Nagaoka 2000) takes the form: " # a 2 b 2 bð1 cþ Gða; bþ ¼ 6ðc 1Þ bð1 cþ 2 þp ð13þ 2 6a 2 P Here c ¼ lim n n!þ1 k¼1 1=k lnn ffi 0: is the Euler Gamma. The Christoffel symbols of the 0-connection Table 7 Percentiles for WAM outputs in the restricted area per month Percentile Jan Feb Mar Apr May Jun Jul Aug Sep Oct Nov Dec P P P 25 = Q P 50 (median) P 75 = Q P P
81 Stoch Environ Res Risk Assess (2012) 26: Fig. 19 The evolution of mean value for WAM modeled and satellite recorded significant wave height in the restricted region through the whole study period Fig. 20 The evolution of standard deviation for WAM modeled and satellite recorded significant wave height in the restricted region through the whole study period (see Amari and Nagaoka 2000; Arwini and Dodson 2007, 2008)inthiscaseare: 6 ca a p2 C 1 11 ¼ 6 p 2 C 2 11 b ¼ a3 p 2 b 2 6 c 2 2c þ p2 C 1 21 ¼ C1 12 ¼ 6 þ 1 p 2 a C 2 21 ¼ 6a 1 c C2 12 ¼ ð Þ ð14þ p 2 b 61 ð cþb c 2 2c þ p2 C 1 22 ¼ 6 þ 1 p 2 a 3 6 c 2 2c þ p2 C 2 22 ¼ 6 þ 1 p 2 a The main-general question that is raised is: With the Weibull parameters a and b known, which is the optimum way of estimating the distance between observations and WAM outputs? Two scenarios are proposed Working for points in the same neighborhood A first approach supported by the information geometric techniques can be based on the projection of the distributions, which fit the data sets, to the same tangent space. Then, their distance is calculated based on the corresponding inner product. For example, the Weibull distribution followed by the satellite data obtained in the 123
82 98 Stoch Environ Res Risk Assess (2012) 26: Fig. 21 The evolution of skewness for WAM modeled and satellite recorded significant wave height in the restricted region through the whole study period Fig. 22 The evolution of kurtosis for WAM modeled and satellite recorded significant wave height in the restricted region through the whole study period Table 9 Weibull parameters for satellite data in the restricted area per month Weibull parameters Jan Feb Mar Apr May Jun Jul Aug Sep Oct Nov Dec a b restricted area of Northwestern European coastline (Sect. 3.2) during August 2008 has shape parameter a = 3.43 and scale b = 2.30 m (see Tables 9, 11). The corresponding values for WAM modeled significant wave height are a = 2.82 and b = 2.35 m. Therefore, the observed and modeled data can be considered as elements u 0 = W(3.43, 2.30), u 1 = W(2.82, 2.35) of the statistical manifold S of all Weibull distributions being projected to the same tangent space. The latter can be chosen to be the tangent space T uo S of u 0 where the inner product, and hence the distances, is defined by the Fisher information matrix at u 0 : 123
83 Stoch Environ Res Risk Assess (2012) 26: Table 10 Weibull parameters for satellite data in the restricted area for the whole study period, the summer and winter months Weibull parameters " G ¼ ð3:43þ2 ð2:30þ 2 # 2:30ð1 cþ ¼ 2:30ð1 cþ 6ðc 1Þ 2 þp 2 6ð3:43Þ 2 62:23 0:97 ; 0:97 0:16 ð15þ The correct distance between u 0 and u 1 would be in this case: qffiffiffiffiffiffiffiffiffiffiffiffiffiffiffiffiffiffiffiffiffiffiffiffiffiffiffiffiffiffiffiffiffiffiffiffiffiffiffiffiffiffi du ð o ; u 1 Þ ¼ ðu o u 1 Þ T Gðu o u 1 Þ ð16þ qffiffiffiffiffiffiffiffiffiffiffiffiffiffiffiffiffiffiffiffiffiffiffiffiffiffiffiffiffiffiffiffiffiffiffiffiffiffiffi which should replace the classical ðu o u 1 Þ T ðu o u 1 Þ used by least square methods in assimilation or other optimizations procedures. In a similar way one may also estimate the distance between any elements of the same tangent space. The novelty compared to the classical least square methods is the use of the Fisher information matrix instead of the identity, incorporating in this way the geometrical structure of the manifold of distributions. The present approach simplifies the estimation of the distance since there is no need of solving complicated systems of differential equations as those corresponding to geodesics (relation 10). However, an approximation error should be expected Using geodesics Summer Winter Overall a b The full exploitation of the information geometric framework proceeds by the use of geodesic curves x ¼ ðx 1 ; x 2 Þ : R! S for the estimation of the distances on a statistical manifold S. This results to a system of second order differential equations (Eq. 10). By substituting the values of the Christoffel C i jk (Spivak 1965, 1979; Dodson and Poston 1991) obtained for the Weibull statistical manifold (Eq. 14), the system becomes: Table 12 Weibull parameters for WAM outputs in the restricted area for the whole study period, the summer and winter months Weibull parameters 6 ca a p2 x 00 1 ðþþ t 6 p 2 x 0 1 b ðþ t 2þ 12 c 2 2c þ p2 6 þ 1 p 2 a 61 ð cþb c 2 2c þ p2 x 0 1 ðþx0 t 2 ðþ t 6 þ 1 p 2 a 3 x 0 2 ðþ t 2¼ 0; x 00 2ðÞ t a3 p 2 b 2 x0 1 ðþ t 2þ 12að1 cþ p 2 x 0 1 b ðþx0 t 2 ðþ t 6 c 2 2c þ p2 6 þ 1 p 2 x 0 2 a ðþ t 2¼ 0; ð17þ In most of the cases, this cannot be solved analytically and the use of approximation methods is necessary. A relevant example is presented here. The Weibull distribution that fits to the satellite data obtained in the restricted area of Northwestern European coastline during August 2008 are used again. Therefore, the probability density function of the satellite records has shape parameter a ¼ 3:43 and scale b = 2.30 m, while for the relevant WAM outputs a ¼ 2:82 and b = 2.35 m. The minimum length curve that gives the distance between the two distributions is a two dimensional curve x ¼ ðx 1 ; x 2 Þthat can be obtained as the solution of the differential system: x :82 2þ0:65x x x 0 2 0:02 2¼ x0 2 0 x :77 2þ0:77x x x 0 2 0:32 2¼ x0 2 0 under the conditions Summer Winter Overall a b x 1 ð0þ ¼ 3:43; x 2 ð0þ ¼ 2:30; x 1 ð1þ ¼ 2:82; x 2 ð1þ ¼ 2:35 By numerically solving this nonlinear system, one reaches the solution presented in Fig. 25. The graphical representations of the geodesic are far from being linear which should be the case if the classical (linear regression) statistical approach has been adopted. In the same figure, the Table 11 Weibull parameters for WAM outputs in the restricted area per month Weibull parameters Jan Feb Mar Apr May Jun Jul Aug Sep Oct Nov Dec a b
84 100 Stoch Environ Res Risk Assess (2012) 26: Fig. 23 The shape parameter a of the Weibull distributions that fit to WAM modeled and satellite recorded significant wave height in the restricted region through all months of 2008 Fig. 24 The scale parameter b (in meters) of the Weibull distributions that fit to WAM modeled and satellite recorded significant wave height in the restricted region through all months of 2008 spray of other geodesics emanating from the same initial point (3.43, 2.30) is also presented. An attempt to visualize further the above approach is made in Fig. 26 a and b where the statistical manifolds formed by the satellite records and WAM outputs (monthly values) are presented as elements of the non-euclidean space that the totality of Weibull distributions define. 5 Conclusions The results of the numerical wave prediction model WAM for an area of increased interest (the north Atlantic ocean) concerning the significant wave height over a period of 1 year were evaluated against corresponding satellite measurements. Special attention was given to the probability distribution functions formed. The outcomes were utilized in order to discuss novel statistical procedures for the quantification of the bias, based on a relatively new branch of mathematics, information geometry, which has not been exploited so far in atmospheric sciences and oceanography. The most important conclusions made follow: Similar but not identical two-parameter Weibull distributions seem to fit to the observational and modeled significant wave height values. In particular, the shape parameter values both for satellite records and WAM outputs increase as moving to offshore areas. The maximum values emerge at the sea area southern of 123
85 Stoch Environ Res Risk Assess (2012) 26: systematic way while the scale analogous values for the wave model outputs, concerning the whole area of study, are slightly underestimated indicating that the satellite records form stretched out distributions. WAM seems slightly but consistently to overestimate the significant wave height through the whole study period. The same holds also for the variability of the simulated values as expressed by the standard deviation that constantly outmatch that of observations. Non negligible differences exist between the ranges of SWH values for WAM outputs and observations. This can be attributed to WAM problems with swell decay as well as to the way of calculation (merging) of satellite records. An increased part of the distribution of modeled values, compared to the corresponding observations, is concentrated at relatively smaller values. This positive asymmetry is highlighted by the increased values of skewness. The variability of WAM outputs is more dependent on extreme values than satellite observations as the increased kurtosis indicates, especially during the summer months. The parameters of the probability density functions that fit the modeled and observational data appear to have significant spatial variation. As a result, the use of the same cost function in optimization systems for the whole domain of the study is a serious simplification. In this respect information geometry techniques provide possible ways out. Two different scenarios for the estimation of distances between the data sets in the study are discussed taking into account that the Weibull distributions form a 2-dimensional non-euclidean space, in particular a Riemannian manifold, avoiding simplifications that classical statistics adopt (use of Euclidean distances): Fig. 25 a The graphical representation of the geodesic (curved line) that gives the minimum length curve connecting the satellite observations with WAM outputs for August The straight line corresponds to the Euclidean (classical) geodesic. b The graphical representation of a numerical solution spray of geodesics emanating from (3.43,2.30) including the one to (2.82, 2.35) that gives the minimum length curve connecting the satellite observations with WAM outputs for August (Color figure online) Iceland. On the other hand, increased scale parameters for both observations and model outputs in the western coast of central Africa can be attributed to non uniform distribution of the sea state in this area. The estimated shape parameters for WAM outputs outmatch those of satellite records in a mild but The first approach utilizes the tangent spaces at the points of interest avoiding solving the complicated differential systems that arise within the information geometric framework. An approximation error is expected in this case. In the second scenario the proposed geometric methodology is fully exploited and the distances are obtained based on the geodesic curves of the statistical manifold that the data in the study form. In both cases the obtained results deviate from those resulted in the classical case. An example/application of the proposed techniques to the northwestern coastline of France and Spain is discussed clarifying the alternative way for the estimation of distances between observations and modeled values. 123
 and WAM outputs (b) as elements of the non- Euclidean space of all Weibull distributions.")
86 102 Stoch Environ Res Risk Assess (2012) 26: Fig. 26 The statistical manifolds formed by the monthly values of the satellite records (a) and WAM outputs (b) as elements of the non- Euclidean space of all Weibull distributions. A classical BlueGreenYellow color palette has been used depending on their approximate divergence from annual averages. (Color figure online) Acknowledgments This work was partially supported by the MARINA project (7th Framework Programme, Grant agreement number: , and the E-wave project (funded by the Research Promotion Foundation of Cyprus, The anonymous reviewers are also acknowledged for their constructive suggestions that essentially contributed to the final form of this work. References Abdalla S, Bidlot J, Janssen P (2005) Assimilation of ERS and ENVISAT wave data at ECMWF. In: ENVISAT & ERS symposium, Salzburg, 6 10 Sep 2004 (ESA SP-572, Apr 2005) Amari S-I (1985) Differential geometrical methods in statistics. Springer lecture notes in statistics, vol 28. Springer-Verlag, Berlin Amari S-I, Nagaoka H (2000) Methods of information geometry. American Mathematical Society, Oxford University Press, Oxford Arwini K, Dodson CTJ (2007) Alpha-geometry of the Weibull manifold. In: Second basic science conference, Tripoli Arwini K, Dodson CTJ (2008) Information geometry: near randomness and near independence. Lecture notes in mathematics, vol Springer-Verlag, Berlin Bidlot J, Janssen P (2003) Unresolved bathymetry, neutral winds and new stress tables in WAM. ECMWF Research Department Memo R60.9/JB/0400 Breivik LA, Reistad M (1994) Assimilation of ERS-1 altimeter wave heights in an operational numerical wave model. Weather Forecast 9(3): Cai Y, Dodson CTJ, Doig A, Wolkenhauer O (2002) Informationtheoretic analysis of protein sequences shows that amino acids self-cluster. J Theor Biol 218(4): Chu PC, Cheng KF (2007) Effect of wave boundary layer on the seato-air dimethylsulfide transfer velocity during typhoon passage. J Mar Syst 66: Chu PC, Cheng KF (2008) South China Sea wave characteristics during Typhoon Muifa passage in winter J Oceanogr 64:1 21 Chu PC, Qi Y, Chen YC, Shi P, Mao QW (2004) South China Sea wave characteristics. Part-1: validation of wavewatch-iii using TOPEX/Poseidon data. J Atmos Ocean Technol 21(11): Dodson CTJ, Poston T (1991) Tensor geometry graduate texts in mathematics, vol 120, 2nd edn. Springer-Verlag, Berlin Emmanouil G, Galanis G, Kallos G, Breivik LA, Heilberg H, Reistad M (2007) Assimilation of radar altimeter data in numerical wave models: an impact study in two different wave climate regions. Ann Geophys 25(3): Ferreira JA, Soares CG (1999) Modelling distributions of significant wave height. Coast Eng 40: Ferreira JA, Soares CG (2000) Modelling the long-term distribution of significant wave height with the Beta and Gamma models. Ocean Eng 26: Galanis G, Anadranistakis M (2002) A one dimensional Kalman filter for the correction of near surface temperature forecasts. Meteorol Appl 9: Galanis G, Louka P, Katsafados P, Kallos G, Pytharoulis I (2006) Applications of Kalman filters based on non-linear functions to numerical weather predictions. Ann Geophys 24: Galanis G, Emmanouil G, Kallos G, Chu PC (2009) A new methodology for the extension of the impact in sea wave assimilation systems. Ocean Dyn 59(3): Gonzalez-Marco D, Bolanos-Sanchez R, Alsina JM, Sanchez-Arcilla A (2008) Implications of nearshore processes on the significant wave height probability distribution. J Hydraul Res 46(2, Suppl. SI): Greenslade D, Young I (2005) The impact of inhomogenous background errors on a global wave data assimilation system. J Atmos Ocean Sci 10(2):61 93 Iguzquiza E, Chica-Olmo M (2008) Geostatistical simulation when the number of experimental data is small: an alternative paradigm. Stoch Environ Res Risk Assess 22: Jansen PAEM (2000) ECMWF wave modeling and satellite altimeter wave data. In: Halpern D (ed) Satellites, oceanography and society. Elsevier, New York, pp Janssen PAEM, Lionello P, Reistad M, Hollingsworth A (1987) A study of the feasibility of using sea and wind information from the ERS-1 satellite, part 2: use of scatterometer and altimeter data in wave modelling and assimilation. ECMWF report to ESA, Reading Kalman RE (1960) A new approach to linear filtering and prediction problems. Trans ASME D 82:35 45 Kalman RE, Bucy RS (1961) New results in linear filtering and prediction problems. Trans ASME D 83: Kalnay E (2002) Atmospheric modeling, data assimilation and predictability. Cambridge University Press, Cambridge Komen G, Cavaleri L, Donelan M, Hasselmann K, Hasselmann S, Janssen PAEM (1994) Dynamics and modelling of ocean waves. Cambridge University Press, Cambridge Lionello P, Günther H, Janssen PAEM (1992) Assimilation of altimeter data in a global third generation wave model. J Geophys Res 97(C9): Lionello P, Günther H, Hansen B (1995) A sequential assimilation scheme applied to global wave analysis and prediction. J Mar Syst 6:
87 Stoch Environ Res Risk Assess (2012) 26: Loffredo L, Monbaliu J, Bitner-Gregersen E, Toffoli A (2009) The role of spectral multimodality in wave climate design. In: Wave Hindcasting Workshop, Halifax Makarynskyy O (2004) Improving wave predictions with artificial neural networks. Ocean Eng 31(5 6): Makarynskyy O (2005) Neural pattern recognition and prediction for wind wave data assimilation. Pac Oceanogr 3(2):76 85 Muraleedharan G, Rao AD, Kurup PG, Unnikrishnan N, Mourani S (2007) Modified Weibull distribution for maximum and significant wave height simulation and prediction. Coast Eng 54: Nordenstrøm N (1973) A method to predict long-term distributions of waves and wave-induced motions and loads on ships and other floating structures. Der Norske Veritas, Publication No. 81 Prevosto M, Krogstad HE, Robin A (2000) Probability distributions for maximum wave and crest heights. Coast Eng 40: Quentin C (2002) Etude de la surface océanique, de sa signature radar et de ses interactions avec le flux turbulent de quantite de mouvement dans le cadre de l expérience FETCH (in French). PhD thesis, Universite de Paris Rao ST, Zurbenko IG, Neagu R, Porter PS, Ku JY, Henry RF (1997) Space and time scales in ambient ozone data. Bull Am Meteor Soc 78(10): Resconi G (2009) Geometry of risk analysis (morphogenetic system). Stoch Environ Res Risk Assess 23: Rosmorduc V, Benveniste J, Lauret O, Maheu C, Milagro M, Picot N (2009) In: Radar altimetry tutorial. Benveniste J, Picot N (eds) Spivak M (1965) Calculus on manifolds. W.A. Benjamin, New York Spivak M (1979) A Comprehensive introduction to differential geometry, vol 1 5, 2nd edn. Publish or Perish, Wilmington Thornton EB, Guza RT (1983) Transformation of wave height distribution. J Geophys Res 88(C10): Vanem E (2011) Long-term time-dependent stochastic modelling of extreme waves. Stoch Environ Res Risk Assess 25: Vanem E, Huseby A, Natvig B (2011) A Bayesian hierarchical spatiotemporal model for significant wave height in the North Atlantic. Stoch Environ Res Risk Assess. doi: /s WAMDIG, The WAM-Development and Implementation Group: Hasselmann S, Hasselmann K, Bauer E, Bertotti L, Cardone CV, Ewing JA, Greenwood JA, Guillaume A, Janssen PAEM, Komen GJ, Lionello P, Reistad M, Zambresky L (1988) The WAM model a third generation ocean wave prediction model. J Phys Oceanogr 18(12): WISE Group (2007) Wave modelling the state of the art. Prog Oceanogr 75:
88 Mar Geophys Res (2012) 33:1 15 DOI /s ORIGINAL RESEARCH PAPER Wave height characteristics in the Mediterranean Sea by means of numerical modeling, satellite data, statistical and geometrical techniques George Galanis Dan Hayes George Zodiatis Peter C. Chu Yu-Heng Kuo George Kallos Received: 8 July 2011 / Accepted: 10 November 2011 / Published online: 26 November 2011 Ó Springer Science+Business Media B.V Abstract In this paper the main wave height characteristics in the Mediterranean Sea are studied from both observational and numerical perspectives. The numerical wave model WAM is employed on a high spatial resolution mode and in two different versions, one of which incorporates information for sea surface currents. Altimeter data obtained from all available satellite missions over the area are also utilized. The data sets are analyzed both by conventional statistical measures as well as by advanced techniques provided by a relatively new branch of mathematics, information geometry, in the framework of which the data under study and the distributions that they form are treated as elements of non Euclidean spaces. In this framework, novel ideas for the estimation of the deviations between the observed and modeled values are proposed. Keywords Numerical wave modeling Significant wave height Satellite altimeter data Information geometry G. Galanis (&) Section of Mathematics, Hellenic Naval Academy, Xatzikyriakion, Piraeus, Greece ggalanis@mg.uoa.gr G. Galanis G. Kallos Department of Physics, Atmospheric Modeling and Weather Forecasting Group, University of Athens, University Campus, Bldg. PHYS-V, Athens, Greece D. Hayes G. Zodiatis Oceanography Centre, University of Cyprus, 1678 Nicosia, Cyprus P. C. Chu Y.-H. Kuo Department of Oceanography, Naval Postgraduate School, Graduate School of Engineering and Applied Science, Monterey, CA 93943, USA Introduction Recent developments and advances in the environmental sciences have increased the interest and the necessity for systems able to accurately monitor and predict meteorological/oceanographic parameters. The main tools that the research community have available today in order to respond adequately to the above issues are two: Observation networks, that record the evolution of the parameters of interest, and mathematical/physical models which simulate their evolution in time and space. The level of difficulty in both approaches increases when focusing on sea wave characteristics: We still lack a dense observational network, analogous to the existing one over land areas, able to provide systematic observations at a sufficient resolution. This fact underlines the importance of satellite data. On the other hand, wave modeling seems to be incomplete without being coupled with atmospheric and currents flow corresponding systems. In the present work a study of the sea wave characteristics in the area of Mediterranean Sea has been attempted. In particular, the spatial and temporal distribution of significant wave height was studied from different points of view: numerical modeling and satellite records. The former approach is based on the use of a state of the art numerical wave prediction system: the WAM model (WAMDIG 1988; Komen et al. 1994; Janssen 2000, 2004; Bidlot et al. 2007; Galanis et al. 2006, 2009; Emmanouil et al. 2007). This is one of the most well tested wave models being used today by several operational and research centres. The model s domain was covering the whole Mediterranean region at a horizontal resolution of 0.05 for one year (2009). In addition, a second version of the model implementing in the simulation procedure information concerning the sea surface currents has been 123
89 2 Mar Geophys Res (2012) 33:1 15 used. The potential benefits for the wave model are investigated. Both model versions are evaluated/compared against corresponding satellite measurements obtained by all available missions in the area (Radar Altimetry project, Rosmorduc et al. 2009). The intercomparison between these independent sources of data provides information both for the Mediterranean Sea wave characteristics and the forecasting abilities of the wave model. It should be noted however, that no climatic generalizations or interannual comparisons could be made since only one year of data have been analyzed. Two different statistical approaches are employed: one adopting conventional methods in which the most representative descriptive statistical indexes describing the wave characteristics are analyzed, and a second focusing on the probability density functions that fit to the data under study. The second approach reveals non trivial deviations between the modeled and recorded data that should be essentially taken into account in assimilation or other optimization procedures (Lionello et al. 1992, 1995; Breivik and Reistad 1994; Janssen 2000; Kalnay 2002; Abdalla et al. 2005a, b; Galanis et al. 2006, 2009). In this framework, advances from a new branch of mathematics, information geometry (Amari 1985; Amari and Nagaoka 2000; Arwini and Dodson 2007, 2008), are employed in order to optimally estimate the distances between different data sets. Special attention is given to the Levantine region (the sea area with longitude and latitude defined by the red rectangle in Fig. 1), in which the homogeneous wave characteristics allow to test/discuss the proposed techniques avoiding lumping non compatible information. The techniques and ideas proposed in this work could be exploited for designing new methods for the optimization of the initial conditions and the final outputs of numerical wave and atmospheric prediction systems since they could support more sophisticated ways of realizing the corresponding cost functions taking into account the geometric properties (scale and shape parameters for example) of the data in study and avoiding simplifications that the classical approaches (least square methods) impose. The presented work is organized as follows: In Models and methodology the models, the data sets and the methodology used is described. Wave modeling is devoted to the wave model employed, Satellite data refers to the satellite records utilized, while Statistical approaches: methodology focuses on the statistical approaches adopted. In Results and Information geometric techniques for the distance estimation between observations and forecasts the results obtained in this study are presented and discussed focusing mainly on the new techniques proposed for the estimation of the distance between observations and forecasts based on information geometric techniques. Finally, concluding thoughts are summarized in Conclusions. Models and methodology Wave modeling The third generation wave model model WAM Cycle 4 ECMWF version (Janssen 2000, 2004; Bidlot et al. 2007)is used for simulating the evolution of the significant wave height in Mediterranean Sea. WAM solves the wave transport equation explicitly without any assumptions on the shape of the wave spectrum (WAMDIG 1988; Komen et al. 1994). It computes the 2-d wave variance spectrum through integration of the transport equation: df dt þ o ou ð _ufþþ o ok ð_ kfþþ o oh ð_ hfþ ¼S; where F(f, h, u, k) denotes the spectral density, f frequencies, h directions, u latitudes and k longitudes. The source function S is represented as a superposition of the wind input S in, white capping dissipation S dis, and nonlinear transfer S nl : S ¼ S in þ S dis þ S nl The wind input term is given by S in ¼ cf; with c the growth rate of the waves. The dissipation source term is based on (Hasselmann 1974) white capping theory according to (Komen et al. 1984). The nonlinear source term is a parameterization of the exact nonlinear interactions as proposed by (Hasselmann et al. 1985). The basic form of the exact nonlinear expression has been retained. However the 5-d continuum of all resonant quadruplets is reduced to a 2-d continuum by considering only a pair of discrete interaction configurations. More details on the theoretical background on which the WAM model is based can be found in (WAMDIG 1988). It is worth also mentioning on the new advection scheme used in the latest version (CY33R1) of the wave model that ECMWF has kindly provided to our group (Bidlot et al. 2007). The corner transport upstream has been adopted replacing the original scheme for oblique propagation. There is also a change in the non-linear source term expression for shallow water. Based on a recent work of Janssen and Onorato 2007), concerning the effects of four wave interactions and the generation of a wave-induced current, the new scheme affects both the time evolution of the wave spectrum and the determination of the kurtosis of the wave field. The model ran for a period of 12 months (year 2009) covering the whole Mediterranean Sea (Latitude 30 N 46 N, Longitude 6 W 36 E, Fig. 1) at a high for a basinscale model spatial resolution (0.05, that is around 4.3 km in longitude differences and 5.5 km in latitude) 123

90 Mar Geophys Res (2012) 33: Fig. 1 The area of interest. The red rectangle indicates the restricted area of study (Levantine Sea). Image courtesy of Google Earth providing outputs at 6-h intervals in order to capture the details of the evolution of sea waves even in areas with a complicated coast line. The wave spectrum was discretized to 25 frequencies (range Hz logarithmically spaced) and 24 directions (equally spaced) while the propagation time step was 120 s. Since the domain of the model covers the whole Mediterranean Sea, WAM was operated in a deep water mode with not bottom refraction, driven by 3-h wind input (10 m wind speed and direction) obtained from the SKIRON regional atmospheric system (Kallos 1997; Papadopoulos et al. 2001) that runs operationally once a day (with 12 UTC initial conditions) at the University of Athens providing 5-day forecasts. 1 The horizontal resolution used for SKIRON system coincides with that of the wave model ( ) while 45 vertical levels stretching from surface to 20 km are employed. The atmospheric system uses NCEP/GFS resolution fields for initial and boundary conditions. The necessary sea surface boundary conditions are interpolated from the SST (Sea Surface Temperature) field analysis retrieved from NCEP on daily basis. Vegetation and topography data are applied at a resolution of 30 s and soil texture data at 120 s. In addition, a second version of the wave model (WAMC for convenience in the following) was employed 1 in which apart from the wind forcing, surface wave currents were also used. In particular, their propagation characteristics both spatially and spectrally (current refraction, frequency bunching) where taken into account. The two horizontal components of the surface sea currents at a resolution of 1/16, approximately 6 km, were provided by the Mediterranean Operational Oceanography Network MOON basin system, known as Mediterranean Forecasting System-MFS (Pinardi et al. 2003). This forecasting system produces daily means of sea temperature and salinity forecasts, with 10-days forecasting horizons, on a daily basis. The system consists of a numerical model (Tonani et al. 2008) and a data assimilation scheme (3DVAR) (Dobricic and Pinardi 2008) capable of assimilating satellite and in situ data. MFS is forced by atmospheric input produced by the European Center for Medium range Weather Forecasts (ECMWF) analyses and forecasts (ECMWF 2005) at and 6 h resolution. The MFS forecasts are validated/compared with observations, providing an assessment of the forecasting products. Satellite data Gridded observational records from the ESA-CNES joint project Radar Altimetry Tutorial were used as observation data. These are near-real time observations for significant wave height obtained by merging all available relevant 123
91 4 Mar Geophys Res (2012) 33:1 15 satellite records from a variety of data centers: ERS-1 and ERS-2 (ESA), Topex/Poseidon (NASA/CNES), Geosat Follow-On (US Navy), Jason-1 (CNES/NASA), Envisat (ESA). In particular, the last 2 days of available data for each satellite are employed and a merged map is generated on daily basis if a minimum of two missions is available. The final outputs are obtained by means of interpolation and cover the area of study for the year 2009 at a resolution of Cross-calibration and quality control of the data are performed using Jason-1 as the reference mission (Rosmorduc et al. 2009). Concerning the accuracy of the satellite data in use, it is well known that bias uncertainty is always a non negligible factor in altimeter error budgets. A variety of factors contribute to this issue: Measurement noise, which depends on the antenna baseline, the error related to ionospheric, tropospheric and sea-state bias effects, the error induced by satellite roll and pitch, which has a direct impact on measurement geometry (Yaplee et al. 1971; Enjolras et al. 2006). However, the fact that the data used in the present study have been resulted within the framework of a major European project coordinated by the European Space Agency and were calibrated against independent measurements provides an important guarantee for their credibility. In particular, the estimated order of magnitude for the bias is from 0 to 50 cm, depending on wave heights (Rosmorduc et al. 2009). The choice of the specific year 2009 has been imposed mainly by data availability reasons. Although this is a statistically sufficient period for obtaining safe results and giving a description of the proposed new techniques, it should be noted that no climatic generalization is asserted. It worth also noticing that a non-trivial difference in the temporal and spatial resolution between the modeled and recorded wave data is present, which, despite the interpolation used for spreading the available information in the framework of Radar Altimetry Tutorial project, may result to sampling error in the analysis. For this reason, our study and results focus on averaged statistical parameters over quarterly periods, during which a sufficient amount of satellite records are available and the previously mentioned errors are eased, avoiding to provide estimations for short time periods or restricted local areas. Despite this, a, possibly systematic, bias could be expected and this underlines the necessity of developing new advanced techniques for the estimation and the subsequent elimination of such discrepancies. This is exactly the framework in which the proposed methodologies aim to provide some new material and ideas. Another point that is mentionable is the recent evidence that wave data from Jason-1 are quite noisy and may not be the best reference there is (see for instance Abdalla et al. 2005a, b; Durrant et al. 2009). An alternative could be provided by the GlobWave project ( in the framework of which data from different satellite missions are also available. Statistical approaches: methodology Two complementary methodologies are used for the statistical analysis of both observations and wave simulations. Firstly, conventional statistical measures provide the basic information for the significant wave height distribution in time and space. More precisely, the following indices were used: Mean value l ¼ 1 N P N i¼1 swhðiþ, were swh denotes the recorded (observed) or simulated significant wave height value and N the size of the sample. qffiffiffiffiffiffiffiffiffiffiffiffiffiffiffiffiffiffiffiffiffiffiffiffiffiffiffiffiffiffiffiffiffiffiffiffiffiffiffiffiffiffiffiffiffiffi 1 Standard Deviation r ¼ N P N i¼1 ðswhðiþ lþ2 Coefficient of variation c v ¼ r l, a normalized measure of the dispersion. N Skewness g 1 ¼ 1P N ðswhðiþ l i¼1 Þ3 r a measure of the 3 asymmetry of the probability distribution. N Kurtosis g 2 ¼ 1P N ðswhðiþ l i¼1 Þ4 r 3 that provides information about the peakedness of the probability 4 distribution. The basic percentiles: P 5,P 10,P 25 = Q 1,P 50 = Median, P 75 = Q 3,P 90 and P 95, that give a detailed view of the distribution of the data in study. It should be noted that the wave data have been descritized in daily averages to the statistical metrics used in order to analyze in a homogeneous way the modeled and recorded values. The second statistical approach is based on information geometry, a relatively new research area with several potential applications that surpass the classical borders of mathematics. In order to make this work as self-contained as possible, a short presentation of the main notions and terminology of information geometric techniques follows. More details and results can be found in Amari 1985; Amari and Nagaoka 2000; Arwini and Dodson 2007, The primary scope is to exploit methods of non- Euclidean geometry in probability theory and stochastic processes. The information geometry provides a manifold framework for a family of probability distributions. Within this, geometrical entities such as Riemannian metrics and distances are introduced. For example, the family of normal distributions of 1-d variables can be treated as a two dimensional manifold where the mean and variance playing the role of coordinates. The main objects of information geometry are the statistical manifolds. Namely, an n-dimensional statistical manifold is a family of probability distributions 123
92 Mar Geophys Res (2012) 33: S ¼ fp n ¼ pðx; nþjn ¼½n 1 ; n 2 ;...; n n Š2Ng ð1þ where each element may be parametrized using the n real valued variables ½n 1 ; n 2 ;...; n n Š in an open subset N of R n and the mapping n! p n is injective and smooth. The geometrical framework of a statistical manifold is given by the Fisher information matrix which at a point n is a n 9 n matrix GðnÞ ¼½g ij ðnþš; ð2þ with g ij ðnþ ¼E Z n ½o i ðx; nþo j ðx; nþš ¼ o i ðx; nþo j ðx; nþpðx; nþdx; i; j ¼ 1; 2;...; n: ð3þ Here o i stands for the partial derivative with respect to the i-th factor, is the log-likelihood function: ðx; nþ ¼ n ðxþ ¼log½pðx; nþš and Z E n ½f Š¼ f ðxþpðx; nþdx ð4þ ð5þ denotes the expectation with respect to the distribution p. The matrix GðnÞ is always symmetric and positive semidefinite. If, in addition, it is positive definite, then a Riemannian metric (see Spivak 1965, 1979) can be defined on the statistical manifold corresponding to the induced inner product: g ij ¼ o i jo j : ð6þ This Riemannian metric is called the Fisher metric or the information metric and is invariant of the choice of the coordinate system. The corresponding geometric properties of this framework are characterized by the so-called Christoffel symbols ðc i jkþ defined by the relations: C jk;h ¼ X2 i¼1 g hi C i jkð h ¼ 1; 2 Þ; ð7þ C jk;h ðnþ ¼E n o j o k n þ 1 2 o j n o k n i; j ¼ 1; 2;...; n: ðo h n Þ ; ð8þ The minimum distance between two elements f 1 and f 2 of a statistical manifold S is defined by the corresponding geodesic x which is the minimum length curve that connects them. Such a curve x ¼ðx i Þ : R! S ð9þ satisfies the following system of 2nd order differential equations: x 00 i ðtþþxn C i jk ðtþx0 j ðtþx0 kðtþ ¼0; i ¼ 1; 2;...; n: ð10þ j;k¼1 under the conditions xð0þ ¼f 1 ; xð1þ ¼f 2 : It is worth noticing at this point, that the above presented framework of information geometric techniques has been exploited so far in a variety of applications in biology and mathematical physics (see Amari and Nagaoka 2000; Arwini and Dodson 2007, 2008). However, to the authors knowledge, similar applications in meteorology and oceanography are still missing, although optimization and assimilation procedures are widely utilized. Results Descriptive statistics The significant wave height characteristics over the whole Mediterranean Sea are studied here based on the descriptive statistical measures listed in the previous section. In order to differentiate between non homogeneous time periods, the data in study (both model results and satellite observations) have been divided in four intervals corresponding to the seasons: Period A covers the winter months (December February), B the spring (March May), C the summer (June August) and D the autumn (September November). In Figs. 2, 3, 4 and 5, the average values of the mean, the standard deviation, the skewness and the kurtosis over every grid point of the domain are presented for the two versions of the wave model (with and without the currents as external information) and the satellite records. The use of the sea surface currents (WAMC) does not change significantly the results of the model simulation since the corresponding statistics are, in general, similar. However, it does increase the mean significant wave height (swh) values as well as the corresponding variability, as expressed by the standard deviation, at specific areas like the Southern France coastline especially during winter months. The elevated variability, in particular, indicates that the increased swh may not be the case for the whole area or time of study. A second interesting outcome concerns the elevated kurtosis values of the model results. This deviation is particularly apparent during the summer period and reveals increased influence of extreme values on the variability of the forecasts. In general, for the western Mediterranean, the study seems to indicate non-uniform distributions of swh (both from skewness and a kurtosis point of view). The Levantine region is affected mainly during the autumn 123
93 6 Mar Geophys Res (2012) 33:1 15 Fig. 2 Basic statistical measures for the two model version: with (WAMC) and without (WAM) current information, as well as for the corresponding satellite records for the months December February period when both the models and the observations agree on the increased values for the two asymmetry measures. The previous information is important especially for applications related with wave energy activities since swh is a crucial component in energy potential estimation. It is worth noticing here that the statistical analysis for the modeled results is based on a wider sample due to the finer resolution (both spatial and temporal) compared to the available satellite records. It is underlined, in this way, the added value of numerical modeling especially in regions with limited available observations. Some more specific conclusions can be made for Levantine due to the relatively homogeneous wave climate. In Figs. 6, 7, 8 and 9 the statistical measures employed are graphically presented in monthly intervals while the relevant percentiles are given in Tables 1, 2 and 3. The model generally underestimates swh, especially in winter. This bias is improved, at least partly, by the use of sea currents. On the other hand, model results (both with and without currents) are more variable and asymmetric, especially during the winter months, compared to the satellite measurements. Beside this, some questions rise for the extrapolation of the satellite data: the mean difference between the model outputs and the observations seems to be too large, which combined with a lack of variability and extremes in the altimeter data it points to a data set that has been heavily smoothed and extrapolated. It is worth noticing at this point that the figures under discussion (6 9) are referring on the available values over the whole Levantine area (longitude and latitude at a horizontal resolution of 0.05 ). As a result a statistical sufficient sample size is ensured. Probability density function fitting In this section, the swh satellite records and the corresponding WAM simulations are studied by distribution fitting. Wave data have been fitted at a significance level of 0.05 or higher (D Agostino and Stephens 1986) to the twoparameter Weibull probability density function: f ðxþ ¼ a x a 1 e ðþ x a b ; a; b [ 0; ð11þ b b where a is the shape and b the scale parameter. This distribution has been proved to describe well sea waves in a number of previous works (Holthuijsen 2007; Muraleedharan et al. 2007). In Figs. 10, 11, 12 and 13 the values of the shape and scale parameter, divided again in four seasons, over every grid point of the domain are plotted for the two WAM 123
94 Mar Geophys Res (2012) 33: Fig. 3 Basic statistical measures for the two model versions: with (WAMC) and without (WAM) current information, as well as for the corresponding satellite records for the months March May Fig. 4 Basic statistical measures for the two model versions: with (WAMC) and without (WAM) current information, as well as for the corresponding satellite records for the months June August 123
 and without (WAM) current information, as well as for the corresponding satellite records for the months September November Fig.")
95 8 Mar Geophys Res (2012) 33:1 15 Fig. 5 Basic statistical measures for the two model versions: with (WAMC) and without (WAM) current information, as well as for the corresponding satellite records for the months September November Fig. 6 The time evolution of the mean swh in the Levantine area versions: including current information (WAMC) and not (WAM) as well as for the corresponding satellite records. The main outcome here is the increased shape parameter values for the satellite records over the whole time period and almost at every area of the Mediterranean Sea. This fact underlines the qualitatively different characteristics between the modeled and measured data that should be taken into account in any optimization procedure (assimilation, local adaptation, etc.). The same holds also for the spatial variability of the results. Elevated shape and scale Fig. 7 The time evolution of the standard deviation of the swh in the Levantine area parameters are revealed during winter in regions with relatively large potential fetch (Ionian sea, southern France to northern Africa). A second important observation is the increased values of the shape parameter in the Levantine area during the summer period as simulated by both versions of the WAM model and recorded by the satellites. More detailed results (monthly averages) for the Levantine area are presented in Figs. 14 and 15 where the evolution in time for the shape and scale parameter of the 123
96 Mar Geophys Res (2012) 33: Tables 4, 5 and 6. Indeed, very limited intervals (with lengths\0.1) is the case for the modeled data (Tables 4, 5) while a slightly increased variation is allowed for the satellite records which, however, is not enough to set under question the discrepancies from the WAM results. Information geometric techniques for the distance estimation between observations and forecasts Fig. 8 The time evolution of the skewness of the swh in the Levantine area Fig. 9 The time evolution of the kurtosis of the swh in the Levantine area Weibull pdf is given. The underestimation of the shape parameters by WAM is reconfirmed and is particularly obvious during the summer months. On the other hand, the systematic underestimation of the scale parameter is in accordance with the decreased mean modeled values in this area (Fig. 6). Again, the use of sea current information in the wave model does not seem to affect crucially the above findings. The statistical significance of these conclusions is supported by the 95% confidence intervals presented in The results obtained in the previous sections reveal non negligible deviations between the modeled and recorded swhs as well as remarkable spatial distribution. This is not something new. Many authors over the years have pointed out possible causes leading the numerical prediction systems to produce errors systematic or not (Janssen et al. 1987; Kalnay 2002; Chu et al. 2004; Greenslade and Young 2005; Galanis et al. 2006; Chu and Cheng 2007, 2008; Emmanouil et al. 2007; Galanis et al. 2009). The local area s peculiarities, the heavy dependence on the initial conditions (mainly for the atmospheric models, see for example Bertotti et al. 2011) and the inability to simulate successfully sub-grid scale phenomena can be listed among them. On the other hand, one should not forget that altimeter data have also errors that tend to be of the same level on a global scale to that of global wave models (Janssen et al. 2007; Abdalla et al. 2010). These facts set under question the way that conventional statistical procedures are employed in order to estimate and minimize the distances between the two types of data sets. Indeed, in the majority of assimilation and other optimization techniques (Kalman 1960; Kalman and Bucy 1961; Lionello et al. 1992, 1995; Breivik and Reistad 1994; Rao et al. 1997; Galanis and Anadranistakis 2002; Kalnay 2002; Makarynskyy 2004, 2005; Abdalla et al. 2005a, b), the obtained cost-functions treat the data in study as elements of Euclidean spaces by employing different versions of the least square method. However, novel advances in a new branch of mathematics, the information geometry, Table 1 Monthly swh values for the percentiles of the WAM (no currents) version for the area of Levantine Percentile Jan Feb Mar Apr May Jun Jul Aug Sep Oct Nov Dec Overall Min % % % (Q1) % (Median) % (Q3) % % Max

97 10 Mar Geophys Res (2012) 33:1 15 Table 2 Monthly swh values for the percentiles of the WAMC version for the area of Levantine Percentile Jan Feb Mar Apr May Jun Jul Aug Sep Oct Nov Dec Overall Min % % % (Q1) % (Median) % (Q3) % % Max Table 3 Monthly swh values for the percentiles of the satellite data for the area of Levantine Percentile Jan Feb Mar Apr May Jun Jul Aug Sep Oct Nov Dec Overall Min % % % (Q1) % (Median) % (Q3) % % Max Fig. 10 The shape and scale parameter for the two model versions: with (WAMC) and without (WAM) current information, as well as for the corresponding satellite records for the months December February prove that such an approach contains serious limiting and simplifications. This is because the distributions of data sets normally are classified in more complicated structures than Euclidean spaces, in which the underlying geometry differ from the classical one (see Amari 1985; Amari and Nagaoka 2000; Arwini and Dodson 2007, 2008). In particular, probability density functions of the same type form differentiable Riemannian manifolds (Spivak 1965, 1979) which can be explicitly defined following standard protocols. Such a description provides a different way for the estimation of distances, since within the Riemannian geometry framework the distance between two elements is given as the length of the geodesic, i.e. the minimum length curve, which is not always a straight line. These new tools can provide more accurate criteria and procedures for the optimization of the model final results. 123
 and without (WAM) current information, as well as for the corresponding satellite")
 and without (WAM) current information, as well as for the corresponding satellite")
98 Mar Geophys Res (2012) 33: Fig. 11 The shape and scale parameter for the two model versions: with (WAMC) and without (WAM) current information, as well as for the corresponding satellite records for the months March May Fig. 12 The shape and scale parameter for the two model versions: with (WAMC) and without (WAM) current information, as well as for the corresponding satellite records for the months June August Fig. 13 The shape and scale parameter for the two model versions: with (WAMC) and without (WAM) current information, as well as for the corresponding satellite records for the months September November 123
99 12 Mar Geophys Res (2012) 33:1 15 Estimating the deviations between WAM forecasts and satellite measurements In this section a first attempt to apply the information geometric techniques described earlier for estimating the divergences between the wave model outputs and the corresponding satellite measurements is made. As already discussed in Probability density function fitting, both data sets follow Weibull distributions. As a result, they can be categorized within the statistical manifold of all 2-parameter Weibull distributions: ( S= pðx; nþ ¼ a ) x a 1 e ðþ b x a ; a and b [ 0 ð12þ b b The log-likelihood function here is: ðx; nþ ¼log½pðx; nþš ¼ log a log b þða 1Þðlog x log bþ x a b ð13þ Fig. 14 The time evolution of the shape parameter in the Levantine area Fig. 15 The time evolution of the scale parameter in the Levantine area and the Fisher information matrix, that defines the geometric entities of the manifold, takes the form: " # a 2 b 2 bð1 cþ Gða; bþ ¼ 6ðc 1Þ bð1 cþ 2 þp ð14þ 2 6a 2 P where the constant c ¼ lim n n!þ1 k¼0 1 n ln n ffi 0:577 is the Euler Gamma. As a result, the Christoffel symbols of the Levi Civita connection (see relations 7, 8) become: C 1 11 ¼ 6 ca a p2 6 p 2 b C 2 11 ¼ a3 p 2 b 2 C 1 21 ¼ C1 12 ¼ 6 c2 2cþ p2 6 þ1 p 2 a C 2 21 ¼ C2 12 ¼ 6að1 cþ ð15þ p 2 b C 1 22 ¼ 6ð1 cþb c2 2cþ p2 6 þ1 C 1 22 ¼ 6 c2 2cþ p2 6 þ1 p 2 a 3 Within this framework, let s focus on the values obtained for October 2009 in the Levantine sea area. The shape and scale parameters for the WAM modeled values were a = and b = 0.551, respectively, for the WAMC version of the model a = and b = and for the satellite corresponding records: a = and b = Taking into account that these values do not deviate significantly, the probability density functions obtained can p 2 a Table 4 Monthly shape and scale parameter values and the corresponding 95% confidence intervals for the WAM (no currents) version at the area of Levantine Weibull parameters Jan Feb Mar Apr May Jun Jul Aug Sep Oct Nov Dec a (Shape parameter) b (Scale parameter) % Confidence intervals for a Jan Feb Mar Apr May Jun Jul Aug Sep Oct Nov Dec Min Max % Confidence intervals for b Jan Feb Mar Apr May Jun Jul Aug Sep Oct Nov Dec Min Max
100 Mar Geophys Res (2012) 33: Table 5 Monthly shape and scale parameter values and the corresponding 95% confidence intervals for the WAM (currents) version at the area of Levantine Weibull parameters Jan Feb Mar Apr May Jun Jul Aug Sep Oct Nov Dec a (Shape parameter) b (Scale parameter) % Confidence intervals for a Jan Feb Mar Apr May Jun Jul Aug Sep Oct Nov Dec Min Max % Confidence intervals for b Jan Feb Mar Apr May Jun Jul Aug Sep Oct Nov Dec Min Max Table 6 Monthly shape and scale parameter values and the corresponding 95% confidence intervals for the satellite at the area of Levantine Weibull parameters Jan Feb Mar Apr May Jun Jul Aug Sep Oct Nov Dec a (Shape parameter) b (Scale parameter) % Confidence intervals for a Jan Feb Mar Apr May Jun Jul Aug Sep Oct Nov Dec Min Max % Confidence intervals for b Jan Feb Mar Apr May Jun Jul Aug Sep Oct Nov Dec Min Max be considered as elements u 0 = W(1.629, 0.551), u 1 = W(1.85, 0.609) and u 2 = W(2.204, 0.665) of the statistical manifold S projected to the same tangent space T u1 S of u 1 where the corresponding inner product is given by the Fisher information matrix at u 1 : " # G ¼ 1:852 ð0:609þ 2 0:609ð1 cþ ¼ 0:609ð1 cþ 6ðc 1Þ 2 þp 2 61:85 2 1:27 0:26 : 0:26 0:53 ð16þ As a result, the distance between u 0 and u 2, that is the bias of the model, is given by: qffiffiffiffiffiffiffiffiffiffiffiffiffiffiffiffiffiffiffiffiffiffiffiffiffiffiffiffiffiffiffiffiffiffiffiffiffiffiffiffiffiffi dðu 0 ; u 2 Þ¼ ðu 0 u 2 Þ T Gðu 0 u 2 Þ ð17þ qffiffiffiffiffiffiffiffiffiffiffiffiffiffiffiffiffiffiffiffiffiffiffiffiffiffiffiffiffiffiffiffiffiffiffiffiffiffiffi which should replace the classical ðu 0 u 2 Þ T ðu 0 u 2 Þ used by least square methods in conventional statistics. Similarly, one can calculate the distance between any elements of the same tangent space. The novelty comparing to the classical least square techniques is the use of the Fisher information matrix G instead of the identity, which incorporates the geometrical structure of the manifold of distributions that fit to the data under study. It is worth noticing, however, that the above approach can be applied only when the deviations between the pdfs in study are not major. When such an assumption cannot be made, the corresponding geodesics, i.e. the minimal length curves, should be employed. The latter are obtained as solutions of a system of 2nd order differential equations, under the conditions xð0þ ¼u 0 ; xð1þ ¼u 2. In the previous example, the utilization of the Christoffel symbols C i jk (Spivak 1965, 1979) obtained for the Weibull statistical manifold (Eq. 15), leads to the system: 6 ca a p2 x 00 1 ðtþþ 6 p 2 x 0 1 b ðtþ 2þ 12 c 2 2c þ p2 6 þ 1 p 2 a 6ð1 cþb c 2 2c þ p2 x 0 1 ðtþx0 2 ðtþ 6 þ 1 p 2 a 3 x 0 2 ðtþ 2¼ 0; x 00 a3 2ðtÞ p 2 b 2 x0 1 ðtþ 2þ 12að1 cþ p 2 x 0 1 b ðtþx0 2 ðtþ 6 c 2 2c þ p2 6 þ 1 p 2 x 0 2 a ðtþ 2¼ 0: ð18þ 123
101 14 Mar Geophys Res (2012) 33:1 15 It becomes obvious that such a system cannot be solved analytically, in general, and the use of some approximation method is necessary. Conclusions The wave characteristics in Mediterranean Sea by means of the swh values were studied based on different and independent sources: Two versions of the wave model WAM, one incorporating wind speed and sea currents as forcing and a second based only on wind speed, ran on a high spatial resolutionmode (0.05 ) for a period of one year (2009) providing detailed information over the whole Med sea. On the other hand, corresponding satellite measurements interpolated to gridded data were utilized based on the results of a recent European project (the Radar Altimetry project, Rosmorduc et al. 2009). The obtained data were studied both by a conventional statistical point of view as well as by employing novel methodologies. The former approach includes a variety of statistical indices in order to have a clear view of the different data in study, to spot model biases as well as possible spatial and temporal variances. The latter employs tools obtained by a new branch of mathematics, the information geometry, in which the probability density functions are treated as elements of non-euclidean structures avoiding simplifications made in classical statistics. The main conclusions obtained can be summarized as follows: The use of surface currents does not result to major changes in the wave model outputs. Nevertheless, it does increase the mean values of the swh. The corresponding variability is also elevated at specific areas during winter months, indicating that one should not expect increased swh for the whole area or time of study. This point could be helpful for monitoring the wave power potential. The modeled data appear to have increased asymmetry, both in view of skewness and kurtosis, compared to the corresponding satellite values, especially during the summer period. This fact reveals increased influence of extreme values on the variability of the simulations. On the other hand questions on the smoothing and extrapolation procedures applied to the observations are raised. A more detailed study was performed for the swh in the homogeneous wave climate of the Levantine Sea. During the autumn period both the models and the observations coincide on increased values for the asymmetry measures. On the other hand, a slight but constant underestimation of the models is revealed which is improved when using sea currents information. In both cases (modeled and recorded data) a probability density function that fits well to the swh values is the two-parameter Weibull distribution. However, interesting deviations emerge for the shape and scale parameters: Over the whole domain of study the satellite records emerge increased shape parameter values for the whole time period in study. The spatial variability of the results is noticeable with main characteristic the increased shape and scale parameters in regions with relatively large potential fetch. In the Levantine sea area particularly increased shape parameter values were emerged during the summer period. The above points underline the different qualitative characteristics between the modeled and measured data as well as between different regions of the Mediterranean Sea. This fact should be taken into consideration in optimization procedures (assimilation, local adaptation, etc.). Towards this direction, some recent advances and statistical tools based on a new area of mathematics/statistics, the information geometry, have been discussed and tested in the last section of this work. New ways of estimating the distances between the data sets at hand are discussed avoiding the use of least square methods that de facto assume flat environments for the data in study. In particular, by employing the Weibull distributions that fit to the data sets at specific areas, a more detailed geometric environment is developed and concrete ways of distance estimation are proposed. Acknowledgment This work was partially supported by the MARINA project (7th Framework Programme, Grant agreement number: , the E-wave project (funded by the Research Promotion Foundation of Cyprus, ucy.ac.cy/ewave/) and the MyOcean project (European Marine Core Service, EU FP7, References Abdalla S, Bidlot J, Janssen P (2005a) Assimilation of ERS and ENVISAT wave data at ECMWF. ENVISAT & ERS symposium, Salzburg, 6 10 September 2004 (ESA SP-572, April 2005) Abdalla S, Bidlot J, Janssen P (2005b) Jason altimeter wave height verification and assimilation. In: Proceedings of the seventh international conference on the Mediterranean coastal environment (MEDCOAST 05), Kusadasi, October 2005, pp Abdalla S, Janssen P, Bidlot J (2010) Jason-2 OGDR wind and wave products: monitoring, validation and assimilation. Mar Geodesy 33(1): doi: / Amari SI (1985) Differential geometrical methods in statistics. Springer lecture notes in statistics 28. Springer, Berlin Amari SI, Nagaoka H (2000) Methods of information geometry. Oxford University Press, Oxford Arwini K, Dodson CTJ (2007) Alpha-geometry of the weibull manifold. Second basic science conference, Tripoli Arwini K, Dodson CTJ (2008) Information geometry: near randomness and near independence. Lecture notes in mathematics Springer, Berlin 123
102 Mar Geophys Res (2012) 33: Bertotti L, Bidlot J, Bunney C, Cavaleri L, Delli Passeri L, Gomez M, Lefevre JM, Paccagnella T, Torrisi L, Valentini A, Vocino A (2011) Performance of different forecast systems in an exceptional storm in the western Mediterranean Sea. Q J R Meteorol Soc. doi: /qj.892 Bidlot J, Janssen P, Abdalla S, Hersbach H (2007) A revised formulation of ocean wave dissipation and its model impact. ECMWF tech. memo ECMWF, Reading, p 27, available online at: Breivik LA, Reistad M (1994) Assimilation of ERS-1 altimeter wave heights in an operational numerical wave model. Weather Forecast 9: Chu PC, Cheng KF (2007) Effect of wave boundary layer on the seato-air dimethylsulfide transfer velocity during typhoon passage. J Marine Syst 66: Chu PC, Cheng KF (2008) South China Sea wave characteristics during Typhoon Muifa passage in winter J Oceanogr 64:1 21 Chu PC, Qi Y, Chen YC, Shi P, Mao QW (2004) South China Sea wave characteristics. Part-1: validation of wavewatch-iii using TOPEX/ poseidon data. J Atmos Ocean Technol 21(11): D Agostino RB, Stephens MA (1986) Goodness-of-fit techniques. Marcel Dekker, New York Dobricic S, Pinardi N (2008) An oceanographic three-dimensional variational data assimilation scheme. Ocean Model 22: Durrant TH, Greenslade D, Simmonds I (2009) Validation of Jason-1 and Envisat remotely sensed wave heights. J Atmos Ocean Sci 26: Emmanouil G, Galanis G, Kallos G, Breivik LA, Heilberg H, Reistad M (2007) Assimilation of radar altimeter data in numerical wave models: an impact study in two different wave climate regions. Ann Geophys 25(3): Enjolras V, Vincent P, Souyris JC, Rodriguez E, Phalippou L, Cazenave A (2006) Performances study of interferometric radar altimeters: from the instrument to the global mission definition. Sensors 6: Galanis G, Anadranistakis M (2002) A one dimensional Kalman filter for the correction of near surface temperature forecasts. Meteorol Appl 9: Galanis G, Louka P, Katsafados P, Kallos G, Pytharoulis I (2006) Applications of Kalman filters based on non-linear functions to numerical weather predictions. Ann Geophys 24: Galanis G, Emmanouil G, Kallos G, Chu PC (2009) A new methodology for the extension of the impact in sea wave assimilation systems. Ocean Dyn 59(3): Greenslade D, Young I (2005) The impact of inhomogenous background errors on a global wave data assimilation system. J Atmos Ocean Sci 10(2):61 93 Hasselmann K (1974) On the characterization of ocean waves due to white capping. Boundary-Layer Meteorol 6: Hasselmann S, Hasselmann K, Allender JH, Barnett TP (1985) Computations and parameterizations of the nonlinear energy transfer in a gravity wave spectrum. Part II: parameterizations of the nonlinear energy transfer for application in wave models. J Phys Oceanogr 15(11): Holthuijsen LH (2007) Waves in oceanic and coastal waters. Cambridge Univesity Press, Cambridge Janssen P (2000) ECMWF wave modeling and satellite altimeter wave data. In: Halpern D (ed) Satellites, oceanography and society. Elsevier, NY, pp Janssen P (2004) The interaction of ocean waves and wind. Cambridge University Press, Cambridge Janssen P, Onorato M (2007) The intermediate water depth limit of the Zakharov equation and consequences for wave prediction. J Phys Oceanogr 37: Janssen P, Lionello P, Reistad M, Hollingsworth A (1987) A study of the feasibility of using sea and wind information from the ERS-1 satellite, part 2: use of scatterometer and altimeter data in wave modelling and assimilation. ECMWF report to ESA, Reading Janssen P, Abdalla S, Hersbach H, Bidlot J (2007) Error estimation of buoy, satellite and model wave height data. J Atmos Ocean Technol 24: Kallos G (1997) The regional weather forecasting system SKIRON. In: Proceedings, symposium on regional weather prediction on parallel computer environments, October 1997, Athens, p 9 Kalman RE (1960) A new approach to linear filtering and prediction problems. Trans ASME Ser D 82:35 45 Kalman RE, Bucy RS (1961) New results in linear filtering and prediction problems. Trans ASME Ser D 83: Kalnay E (2002) Atmospheric modeling, data assimilation and predictability. Cambridge University Press, New York Komen G, Hasselmann S, Hasselmann K (1984) On the existence of a fully developed windsea spectrum. J Phys Oceanogr 14: Komen G, Cavaleri L, Donelan M, Hasselmann K, Hasselmann S, Janssen P (1994) Dynamics and modelling of ocean waves. Cambridge University Press, Cambridge Lionello P, Günther H, Janssen P (1992) Assimilation of altimeter data in a global third generation wave model. J Geophys Res 97(C9): Lionello P, Günther H, Hansen B (1995) A sequential assimilation scheme applied to global wave analysis and prediction. J Marine Syst 6: Makarynskyy O (2004) Improving wave predictions with artificial neural networks. Ocean Eng 31(5 6): Makarynskyy O (2005) Neural pattern recognition and prediction for wind wave data assimilation. Pac Oceanogr 3(2):76 85 Muraleedharan G, Rao AD, Kurup PG, Unnikrishnan N, Mourani S (2007) Modified Weibull distribution for maximum and significant wave height simulation and prediction. Coast Eng 54: Papadopoulos A, Katsafados P, Kallos G (2001) Regional weather forecasting for marine application. Global Atmos Ocean Syst 8(2 3): Pinardi N, Allen I, De Mey P, Korres G, Lascaratos A, Le Traon PY, Maillard C, Manzella G, Tziavos C (2003) The Mediterranean ocean forecasting system: first phase of implementation ( ). Ann Geophys 21(1):3 20 Rao ST, Zurbenko IG, Neagu R, Porter PS, Ku JY, Henry RF (1997) Space and time scales in ambient ozone data. Bull Am Meteor Soc 78(10): Rosmorduc V, Benveniste J, Lauret O, Maheu C, Milagro M, Picot N (2009) Radar altimetry tutorial. In: Benveniste J, Picot N (ed). Spivak M (1965) Calculus on manifolds. W. A. Benjamin, New York Spivak M (1979) A comprehensive introduction to differential geometry, vol 1 5, 2nd edn. Publish or Perish, Wilmington Tonani M, Pinardi N, Adani N, Bonazzi A, Coppini G, De Dominicis M, Dobricic S, Drudi M, Fabbroni N, Fratianni C, Grandi A, Lyubartsev S, Oddo P, Pettenuzzo D, Pistoia J, Pujol I (2008) The Mediterranean ocean forecasting system, coastal to global operational oceanography: achievements and challenges. In: Proceedings of the fifth international conference on EuroGOOS May 2008, Exeter WAMDIG (The WAM-Development and Implementation Group), Hasselmann S, Hasselmann K, Bauer E, Bertotti L, Cardone CV, Ewing JA, Greenwood JA, Guillaume A, Janssen P, Komen G, Lionello P, Reistad M, Zambresky L (1988) The WAM model: a third generation ocean wave prediction model. J Phys Oceanogr 18(12): Yaplee BS et al (1971) Nanoseconds radar observations of the ocean surface from a stable platform. IEEE Trans Geosci Electron GE- 9:
103 ΣΟ ΠΡΟΓΡΑΜΜΑ E-WAVE: ΔΚΣΗΜΖΖ ΣΟΤ ΘΑΛΑΗΟΤ ΔΝΔΡΓΔΗΑΚΟΤ ΓΤΝΑΜΗΚΟΤ ΣΖΝ ΠΔΡΗΟΥΖ ΣΖ ΚΤΠΡΟΤ Γαλάνηρ Γ. 1,2, Εωδιάηηρ Γ. 1, Hayes D. 1, Νικολαΐδηρ Α. 1, Γεωπγίος Γ. 1, ηςλιανού. 1, Κάλλορ Γ. 2, Καλογεπή Υ. 2, Chu P.C. 3, Υαπαλάμποςρ Α. 4, αββίδος Κ. 5, Μισαηλίδηρ. 5 1 Ωκεανογραθικό Κένηρο, Πανεπιζηήμιο Κύπροσ, P.O. Box 20537, Λεσκωζία, Κύπρος 2 Ομάδα Αημοζθαιρικών Μονηέλων και Πρόγνωζης Καιρού, Τμήμα Φσζικής, Πανεπιζηήμιο Αθηνών, Πανεπιζηημιούπολη, Κηήριο Φσζικής V, Αθήνα, Ελλάδα 3 Department of Oceanography, Naval Postgraduate School, Monterey, CA 93943, USA 4 Ενεργειακό Γραθείο Κσπρίων Πολιηών, Οδός Λεύκωνος 20, 2064 Σηρόβολος, Λεσκωζία, Κύπρος 5 Μεηεωρολογική Υπηρεζία Κύπροσ, Λεοθώρος Νίκης 28, Λεσκωζία, Κύπρος Η θπκαηηθή ελέξγεηα, ε ελέξγεηα δειαδή πνπ κπνξεί λα παξαρζεί από ηνλ ζαιάζζην θπκαηηζκό, είλαη κηα ελαιιαθηηθή πεγή αλαλεώζηκεο ελέξγεηαο πνπ δελ έρεη αθόκε αμηνπνηεζεί ζηνλ ίδην βαζκό κε άιιεο κνξθέο «θαζαξήο» ελέξγεηαο παξά ηα ζπγθξηηηθά πιενλεθηήκαηα πνπ παξνπζηάδεη όπσο ε ρακειή κεηαβιεηόηεηα πνπ δηεπθνιύλεη ηελ ελζσκάησζή ηεο ζην γεληθό δίθηπν. ηα πιαίζηα ηνπ πξνγξάκκαηνο E-wave, πνπ ζπληνλίδεηαη από ην Ωθεαλνγξαθηθό Κέληξν ηνπ Παλεπηζηεκίνπ ηεο Κύπξνπ, γίλεηαη κηα νινθιεξσκέλε πξνζπάζεηα κειέηεο απηήο ηεο κνξθήο ελέξγεηαο ζηελ πεξηνρή ηεο Αλαηνιηθήο Μεζνγείνπ κε έκθαζε ηελ απνθιεηζηηθή νηθνλνκηθή δώλε ηεο Κύπξνπ. ηελ παξνύζα εξγαζία παξνπζηάδνληαη ηα ηερληθά εξγαιεία πνπ ρξεζηκνπνηνύληαη ζηελ θαηεύζπλζε απηή, ηα νπνία πεξηιακβάλνπλ αξηζκεηηθά κνληέια πξνζνκνίσζεο αηκνζθαηξηθώλ θαη θπκαηηθώλ δηεξγαζηώλ αιιά θαη λέεο ζηαηηζηηθέο κεζόδνπο γηα ηελ εθηίκεζε ηεο θαηαλνκήο ηνπ ελεξγεηαθνύ δπλακηθνύ, θαζώο θαη ηα πξώηα απνηειέζκαηα ηνπ πξνγξάκκαηνο. Λέξειρ κλειδιά: Κπκαηηθή ελέξγεηα, αξηζκεηηθά κνληέια πξόγλσζεο-πξνζνκνίσζεο αηκνζθαηξηθώλ θαη θπκαηηθώλ παξακέηξσλ THE E-WAVE PROJECT: ESTIMATION OF WAVE POWER POTENTIAL IN CYPRUS Galanis G. 1,2, Zodiatis G. 1, Hayes D. 1, Nikolaidis A. 1, Georgiou G. 1, Stylianou S. 1, Kallos G. 2, Kalogeri C. 2, Chu P.C. 3, Charalampous A. 4, Savidou K. 5, Michaelides S. 5 1 Oceanography Centre, University of Cyprus, P.O. Box 20537, Nicosia, Cyprus 2 Atmospheric Modeling and Weather Forecasting Group, Department of Physics, University of Athens, University Campus, Building PHYSICS V, Athens, Greece 3 Department of Oceanography, Naval Postgraduate School, Monterey, CA 93943, USA 4 Cyprus Energy Agency, 20 Lefkonos str, Strovolos, Nicosia, Cyprus 5 Meteorological Service of Cyprus, 28 Nikis Avenue, Nicosia, Cyprus The wave energy, that is the energy that can be captured by the sea waves, is an alternative form of renewable energy which has not been exploited so far as other forms of clean energy despite some critical advantages that it possess like the low variability that allows the easier adaptation to the general grid. The E-wave project, coordinated by the Oceanographic Institute of the University of Cyprus, targets to an integrated study of the wave energy in the area of eastern Mediterranean and especially over the Exclusive Economic Zone of Cyprus. In this paper, the models used and developed in this project are presented, including numerical atmospheric/wave systems and statistical methodologies developed for the estimation of the wave energy potential, while some first results are discussed. Keywords: Wave Energy, Numerical atmospheric and wave prediction-simulation models 1
104 1. Διζαγωγή Η παγθόζκηα νηθνλνκηθή ζπγθπξία θαη ηδηαίηεξα ε ξαγδαία αύμεζε ησλ ηηκώλ ηνπ πεηξειαίνπ, ζε ζπλδπαζκό κε ηηο πξνεηδνπνηήζεηο ηεο επηζηεκνληθήο θνηλόηεηαο γηα ηα πξνβιήκαηα ηεο ππεξζέξκαλζεο ηνπ πιαλήηε θαη ηελ πηζαλή θιηκαηηθή αιιαγή, αιιά θαη ηα εξσηεκαηηθά ζρεηηθά κε ηελ αζθάιεηα ησλ ππξεληθώλ εξγνζηαζίσλ παξαγσγήο ελέξγεηαο, έρνπλ δηακνξθώζεη έλα λέν ελεξγεηαθό πιαίζην πνιηηηθήο γηα ηελ Επξσπατθή Έλσζε ζηξέθνληαο ηελ πιεηνςεθία ησλ θξαηώλκειώλ ζηελ πηνζέηεζε θαη ελζσκάησζε λέσλ κνξθώλ ελέξγεηαο κε ηδηαίηεξε έκθαζε ζηηο αλαλεώζηκεο πεγέο. ην πιαίζην απηό, κηα λέα κνξθή αλαλεώζηκεο ελέξγεηαο έξρεηαη ζην πξνζθήλην ηα ηειεπηαία ρξόληα: Η θπκαηηθή ελέξγεηα, ε ελέξγεηα δειαδή πνπ κπνξεί λα παξαρζεί από ηνλ ζαιάζζην θπκαηηζκό. Πξόθεηηαη γηα κία από ηηο πιένλ ζηαζεξέο πεγέο «θαζαξήο» ελέξγεηαο κε ζεκαληηθά κηθξόηεξν βαζκό αβεβαηόηεηαο θαη κεηαβιεηόηεηαο θαη άξα κε ζπγθξηηηθά πιενλεθηήκαηα ζηελ ελζσκάησζή ηεο ζην δίθηπν παξαγσγήο. Από ηελ άιιε κεξηά, νη επηπηώζεηο ζην ηνπηθό πεξηβάιινλ από ηελ εγθαηάζηαζε ζαιάζζησλ πάξθσλ εθκεηάιιεπζεο ηεο θπκαηηθήο ελέξγεηαο είλαη ζπλήζσο πεξηνξηζκέλεο ελώ ππάξρνπλ θαη λέεο δπλαηόηεηεο ζπλδπαζκέλεο αλάπηπμεο ππνδνκώλ, όπσο γηα παξάδεηγκα ιηκελνβξαρίνλεο, κνλάδεο αθαιάησζεο θ.α., πνπ ιεηηνπξγνύλ παξάιιεια κε ηηο πιαηθόξκεο παξαγσγήο ελέξγεηαο. Σν Ωθεαλνγξαθηθό Κέληξν ηνπ Παλεπηζηεκίνπ ηεο Κύπξνπ ζε ζπλεξγαζία κε ην Παλεπηζηήκην Αζελώλ, ην Naval Postgraduate School ησλ Ηλσκέλσλ Πνιηηεηώλ, ηελ Μεηεσξνινγηθή Τπεξεζία ηεο Κύπξνπ θαη ην Ελεξγεηαθό Γξαθείν Κππξίσλ Πνιηηώλ ζπλεξγάδνληαη ζηα πιαίζηα ηνπ πξνγξάκκαηνο E-wave κε ζηόρν ηελ κειέηε θαη θαηαγξαθή ηεο θπκαηηθήο ελέξγεηαο ζηελ πεξηνρή ηεο Κύπξνπ θαη ηεο Αλαηνιηθήο Μεζνγείνπ γεληθόηεξα. Κύξηνο ζηόρνο ηνπ πξνγξάκκαηνο είλαη ε δεκηνπξγία ελόο ςεθηαθνύ ράξηε πςειήο αλάιπζεο πνπ ζα απνηππώλεη ην ελεξγεηαθό δπλακηθό θαζώο θαη ηα θιηκαηνινγηθά ραξαθηεξηζηηθά ηνπ αλέκνπ θαη ησλ ζαιάζζησλ θπκάησλ ζηελ Απνθιεηζηηθή Οηθνλνκηθή Ζώλε (ΑΟΖ) ηεο Κύπξνπ θαη ηελ επξύηεξε αλαηνιηθή Λεβαληίλε. Επίζεο, κε ηε βνήζεηα λέσλ ππνινγηζηηθώλ κνληέισλ ζα κπνξνύλ λα πξαγκαηνπνηεζνύλ βξαρππξόζεζκεο θαη καθξνπξόζεζκεο πξνβιέςεηο θαη πνζνηηθνπνηήζεηο ηεο θπκαηηθήο ελέξγεηαο ζηελ πην πάλσ πεξηνρή. Γηα ηελ επίηεπμε ησλ ζηόρσλ απηώλ, ρξεζηκνπνηνύληαη κηα ζεηξά από κνληέια πξνζνκνίσζεο αηκνζθαηξηθώλ θαη θπκαηηθώλ δηεξγαζηώλ ηειεπηαίαο γεληάο ελώ αλαπηύζζνληαη, ζηα πιαίζηα ηνπ έξγνπ, λέα καζεκαηηθά/ζηαηηζηηθά ζπζηήκαηα πνπ εμαζθαιίδνπλ ηε βέιηηζηε ηνπηθή πξνζαξκνγή ησλ απνηειεζκάησλ, ηελ εθηίκεζε ηνπ ελεξγεηαθνύ δπλακηθνύ βάζεη ησλ ηνπηθώλ πεξηβαιινληνινγηθώλ ραξαθηεξηζηηθώλ, θαη ηελ κειέηε ηεο ρσξν-ρξνληθήο θαηαλνκήο ηνπ. ηελ εξγαζία απηή παξνπζηάδνληαη ηα ηερληθά εξγαιεία πνπ ρξεζηκνπνηνύληαη ζηα πιαίζηα ηνπ πξνγξάκκαηνο E-wave, νη λέεο κέζνδνη πνπ αλαπηύζζνληαη θαζώο θαη ηα πξώηα απνηειέζκαηα ηνπ έξγνπ. Πην ζπγθεθξηκέλα, ζηελ παξάγξαθν 2 πεξηγξάθνληαη ηα κνληέια πξνζνκνίσζεο ησλ αηκνζθαηξηθώλ θαη θπκαηηθώλ παξακέηξσλ ζηελ πεξηνρή ελδηαθέξνληνο θαζώο θαη λέεο ζηαηηζηηθέο κέζνδνη γηα ηελ ηνπηθή πξνζαξκνγή ησλ απνηειεζκάησλ ησλ πξνεγνύκελσλ κνληέισλ θαη γηα ηελ εθηίκεζε ηνπ αληίζηνηρνπ ελεξγεηαθνύ δπλακηθνύ. ηελ ηξίηε παξάγξαθν παξνπζηάδνληαη ηα πξώηα απνηειέζκαηα ηνπ έξγνπ ελώ ηα βαζηθά ζπκπεξάζκαηα ζπλνςίδνληαη ζηελ παξάγξαθν Σα μονηέλα πος σπηζιμοποιήθηκαν Γηα ηελ ππνζηήξημε ησλ δξαζηεξηνηήησλ ηνπ πξνγξάκκαηνο E-wave, ρξεζηκνπνηήζεθαλ δύν αξηζκεηηθά κνληέια πξνζνκνίσζεο αηκνζθαηξηθώλ θαη θπκαηηθώλ δηεξγαζηώλ ελώ αλαπηύρζεθαλ θαη λέα ζπζηήκαηα γηα ηελ εμάιεηςε ηπρόλ ζπζηεκαηηθώλ ζθαικάησλ ζηηο πξνζνκνηώζεηο αιιά θαη εθηίκεζεο ηεο αληίζηνηρεο θπκαηηθήο ελέξγεηαο Σο αημοζθαιπικό μονηέλο Skiron/Eta Γηα ηελ πξνζνκνίσζε ησλ αηκνζθαηξηθώλ δηεξγαζηώλ θαη ηδηαίηεξα ηεο ηαρύηεηαο θαη δηεύζπλζεο ηνπ αλέκνπ ρξεζηκνπνηήζεθε ην κνληέιν SKIRON (Kallos 1997, Papadopoulos et al. 2001, Katsafados 2003). Πξόθεηηαη γηα έλα θπζηθό, κε πδξνζηαηηθό κνληέιν βαζηζκέλν ζην αηκνζθαηξηθό κνληέιν 2

105 πξόγλσζεο θαηξνύ Eta/NCEP (Janjic, 1994) θαη ζπκπιεξσκέλν κε κηα ζεηξά από ξνπηίλεο πξν- θαη κεηά- επεμεξγαζηώλ, ηθαλό λα πξνζνκνηώζεη κε επηηπρία θαηλόκελα όπσο νη θαηαθόξπθεο θηλήζεηο ηνπ αλέκνπ, ε ηύξβε θαη ην ελεξγεηαθό ηζνδύγην ηεο επηθάλεηαο ηνπ εδάθνπο. Σν κνληέιν Skiron είλαη θαηάιιειν γηα ηνπηθέο θαη κέζεο θιίκαθαο πξνζνκνηώζεηο, ζε πεξηνρέο κε πνηθίια θπζηνγξαθηθά ραξαθηεξηζηηθά θαη ζε κεγάιν εύξνο αλαιύζεσλ. ηελ έθδνζε πνπ ρξεζηκνπνηήζεθε γηα ην πξόγξακκα E-wave, ην ζύζηεκα ΚΘΡΩΝ βαζίζηεθε ζε αξρηθά κεηεσξνινγηθά δεδνκέλα από ην NCEP/GFS system αλάιπζεο 0.5 0, δεδνκέλα επηθαλεηαθήο ζεξκνθξαζίαο ηεο ζάιαζζαο ζηελ ίδηα αλάιπζε θαη δεδνκέλα βιάζηεζεο θαη ηνπνγξαθίαο ζε αλάιπζε 2. Σν πεδίν ηνπ SKIRON θαιύπηεη όιε ηελ πεξηνρή ηεο Μεζνγείνπ κε νξηδόληην πιέγκα 0.05x0.05 km (Εηθόλα 1). Εηθ. 1: Σν πεδίν ηνπ κε- πδξνζηαηηθνύ ζπζηήκαηνο SKIRON Σο κςμαηικό μονηέλο WAM. Γηα ηελ αζθαιή εθηίκεζε ηνπ ζαιάζζηνπ θιίκαηνο ζηελ πεξηνρή ηεο αλαηνιηθήο Μεζνγείνπ, ζηα πιαίζηα ηνπ πξνγξάκκαηνο E-wave πξαγκαηνπνηήζεθαλ πξνζνκνηώζεηο ηνπ ζαιάζζηνπ θπκαηηζκνύ γηα ρξνληθή πεξίνδν δέθα εηώλ ( ). Γηα ηηο πξνζνκνηώζεηο απηέο ρξεζηκνπνηήζεθε ε ηειεπηαία έθδνζε ηνπ θπκαηηθνύ κνληέινπ WAM-ECMWF parallel version, Cycle 33R1 (Janssen 2000; Janssen 2004; Bidlot et al. 2007). Πξόθεηηαη έλα κνληέιν ηξίηεο γεληάο πνπ βαζίδεηαη ζηνλ ππνινγηζκό ελεξγεηαθνύ θάζκαηνο (wave spectrum) αλεκνγελώλ θπκάησλ, επξέσο ρξεζηκνπνηνύκελν θαη από ηα πιένλ αμηόπηζηα. ηελ έθδνζε ηνπ κνληέινπ πνπ ρξεζηκνπνηήζεθε έρεη ελζσκαησζεί έλα λέν ππνινγηζηηθό ζρήκα ην νπνίν ιακβάλεη ππόςε πεξηζζόηεξα ζεκεία ηνπ πιέγκαηνο νινθιήξσζεο εμαζθαιίδνληαο ηελ πην νκαιή πξνζνκνίσζε ηνπ ζαιάζζηνπ θπκαηηζκνύ, θαζώο επίζεο λέα παξακεηξνπνίεζε γηα νινθιήξσζε ηνπ κνληέινπ ζε ξερά λεξά (Janssen and Onorato, 2007) θαη λέν ζρήκα εθηίκεζεο αθξαίσλ ηηκώλ (Mori and Janssen, 2006). Οη πξνζνκνηώζεηο πνπ εθηειέζηεθαλ θάιπςαλ ηελ επξύηεξε πεξηνρή ηεο Αλαηνιηθήο Μεζνγείνπ (30N 41N, 15E 37E) ώζηε λα αλαπαξαζηαζνύλ επηηπρώο επί ηεο πεξηνρήο ελδηαθέξνληνο (Λεβαληίλε, 30.0N-38.0N, 27.5E 36.5E, βι. Εηθόλα 2) ηα κεγάιεο πεξηόδνπ κεηαθεξόκελα θύκαηα (swell) πνπ επηθξαηνύλ ζπλήζσο. Υξεζηκνπνηήζεθαλ αηκνζθαηξηθά δεδνκέλα (ηαρύηεηα θαη δηεύζπλζε αλέκνπ) από ην ζύζηεκα Skiron (βι. παξάγξαθν 2.1) ελώ ε νινθιήξσζε έγηλε ζε ηδηαίηεξα πςειή δηαθξηηηθή ηθαλόηεηα (1/60 x 1/60 degrees) παξέρνληαο δεδνκέλα ζε 3-σξα ρξνληθά δηαζηήκαηα γηα έλα επξύ θάζκα θπκαηηθώλ παξακέηξσλ: εκαληηθό ύςνο θαη δηεύζπλζε θύκαηνο, κέζε θαη κέγηζηε πεξίνδνο θπκαηηζκνύ, αλεκνγελλήο θαη κεηαθεξόκελε ζπληζηώζα θαζώο θαη κέγηζην αλακελόκελν ύςνο θύκαηνο. Σν θάζκα ηεο θπκαηηθήο ελέξγεηαο δηαθξηηνπνηήζεθε ζε 25 ζπρλόηεηεο (εύξνο

106 Hz ινγαξηζκηθά απμαλόκελν) θαη 24 - ίζνπ εύξνπο - δηαζηήκαηα δηεπζύλζεσλ. Γηα ηηο απμεκέλεο αλάγθεο ζε ππνινγηζηηθό ρώξν θαη ρξόλν πνπ πξνέθπςαλ ρξεζηκνπνηήζεθε ν ππεξππνινγηζηήο ηνπ Naval Postgraduate School ζην Monterey ησλ Ηλσκέλσλ Πνιηηεηώλ. Πξόθεηηαη γηα έλα cluster πνπ απνηειείηαη από 144 nodes κε 8 ππξήλεο ζην θάζε έλα θαη ζπλνιηθά 1152 επεμεξγαζηέο, 1.17TB RAM κλήκε θαη 112TB ρσξεηηθόηεηα απνζήθεπζεο. Εηθόλα 2. Η πεξηνρή νινθιήξσζεο ηνπ θπκαηηθνύ κνληέινπ. Με θόθθηλν πιαίζην ζεκεηώλεηαη ε πεξηνρή ελδηαθέξνληνο ηνπ πξνγξάκκαηνο E-wave ηαηιζηικά μονηέλα ηοπικήρ πποζαπμογήρ και εκηίμηζηρ ενέπγειαρ. Σα αξηζκεηηθά κνληέια πξόγλσζεο-πξνζνκνίσζεο αηκνζθαηξηθώλ θαη θπκαηηθώλ παξακέηξσλ πξνζθέξνπλ ζήκεξα ζηελ επηζηεκνληθή θνηλόηεηα αιιά θαη ζηα επηρεηξεζηαθά θέληξα πνπ ηα ρξεζηκνπνηνύλ εμαηξεηηθά απνηειέζκαηα ηδηαίηεξα όηαλ ρξεζηκνπνηνύληαη ζε κέζε ή κεγάιε θιίκαθα. ε πξνζνκνηώζεηο όκσο πνπ εζηηάδνπλ ζε ηνπηθά ραξαθηεξηζηηθά είλαη πηζαλή ε εκθάληζε ζπζηεκαηηθώλ ζθαικάησλ. Πξόθεηηαη γηα έλα πνιππαξακεηξηθό γλσζηό πξόβιεκα ζην νπνίν ζπλεηζθέξνπλ ηόζν νη δπζθνιίεο παξακεηξνπνίεζεο νξηζκέλσλ θπζηθώλ θαηλνκέλσλ όζν θαη ε αδπλακία πξνζνκνίσζεο δηεξγαζηώλ πνπ ζπληεινύληαη ζε θιίκαθεο κηθξόηεξεο από ηε δηαθξηηηθή ηθαλόηεηα ηνπ κνληέινπ (subgrid scale phenomena). Μία ηθαλνπνηεηηθή απάληεζε ζηα παξαπάλσ πξνβιήκαηα κπνξεί λα δνζεί κε ηε ρξήζε ζηαηηζηηθώλ κεζόδσλ πνπ, ιακβάλνληαο ππόςε θαη ηνπηθέο κεηξήζεηο-παξαηεξήζεηο, κπνξνύλ λα ειαρηζηνπνηήζνπλ ηπρόλ ζπζηεκαηηθέο απνθιίζεηο ησλ κνληέισλ. ηελ παξνύζα κειέηε, γηα ηνλ ζθνπό απηό αλαπηύρζεθε κία ζηαηηζηηθή κεζνδνινγία βαζηζκέλε ζε θίιηξα Kalman (Kalman 1960, Kalman and Bucy 1961, Kalnay 2002, Galanis and Anadranistakis 2002, Crochet 2004, Louka et al. 2008, Galanis et al. 2011). Πξόθεηηαη γηα ζηαηηζηηθνύο αιγνξίζκνπο πνπ, ρξεζηκνπνηώληαο κεζόδνπο ειαρίζησλ ηεηξαγώλσλ, ζπλδπάδνπλ παξαηεξήζεηο θαη απνηειέζκαηα ησλ κνληέισλ εθηηκώληαο ζηαηηζηηθά βάξε πνπ κεηώλνπλ ηηο αληίζηνηρεο απνθιίζεηο. Σν βαζηθό πιενλέθηεκα ησλ θίιηξσλ Kalman είλαη ε εύθνιε πξνζαξκνγή ζε θάζε κεηαβνιή ησλ παξαηεξνύκελσλ ηηκώλ θαζώο θαη ην γεγνλόο όηη ρξεηάδεηαη λα ζπκπεξηιάβνπλ κηθξό εύξνο πξνεγνύκελεο πιεξνθνξίαο. ηα πιαίζηα ηνπ έξγνπ E-wave ρξεζηκνπνηήζεθε έλα γξακκηθό θίιηξν Kalman γηα ηε δηόξζσζε ησλ ηηκώλ ηνπ ζεκαληηθνύ ύςνπο θύκαηνο (Hs i ). Ο βαζηθόο αιγόξηζκνο πνπ ρξεζηκνπνηήζεθε είλαη: t t O t x ( t ) x ( t ) ( t ), y H [x ( t )] i 1 i i i i i i (1) 4
107 O όπνπ κε y a a Hs i 0,i 1,i i i ζπκβνιίδεηαη ην ζθάικα ηνπ κνληέινπ ηε ρξνληθή ζηηγκή t i, 0, 1, i i i T x ( t ) a a είλαη ην δηάλπζκα ησλ ζπληειεζηώλ ην νπνίν πξέπεη λα εθηηκεζεί από ην θίιηξν θαη ( ), ηα κε ζπζηεκαηηθά ζθάικαηα. t i i Σα ηειηθά-θηιηξαξηζκέλα απνηειέζκαηα ησλ πξνζνκνηώζεσλ γηα ην ζεκαληηθό ύςνο θύκαηνο (H s ) θαη ηελ πεξίνδν (T e ) ηνπ θπκαηηζκνύ ρξεζηκνπνηήζεθαλ γηα ηελ εθηίκεζε ηνπ δηαζέζηκνπ ελεξγεηαθνύ δπλακηθνύ βάζεη ηνπ ηύπνπ (βι. Pontes M.T., 1998): 2 g 2 P H T (2) s e 64 όπνπ ρ ε ππθλόηεηα ηνπ λεξνύ θαη g ε επηηάρπλζε ηεο βαξύηεηαο. Σα δεδνκέλα πνπ πξνέθπςαλ γηα ηελ θπκαηηθή ελέξγεηα πξνζεγγίζηεθαλ κέζσ κηαο ζεηξάο από ζηαηηζηηθνύο ειέγρνπο (fitting tests) κε ζηόρν ηνλ πξνζδηνξηζκό ηεο θαηαλνκήο πνπ ηα πεξηγξάθεη θαηά ην βέιηηζην δπλαηό ηξόπν. Πην ζπγθεθξηκέλα ρξεζηκνπνηήζεθαλ Kolmogorov-Smirnov θαη Anderson-Darling tests (D'Agostino et. al., 1986) θαζώο θαη κηα ζεηξά από θαηαλνκέο: Logistic, Normal, Gamma, Log-Gamma, Log-Logistic, Lognormal, Weibull, Generalized Logistic. 3. Αποηελέζμαηα Παξά ην γεγνλόο όηη ην πξόγξακκα E-wave δελ έρεη αθόκε νινθιεξσζεί, θάπνηα πξώηα ζπκπεξάζκαηα κπνξνύλ λα ζηνηρεηνζεηεζνύλ βάζεη ησλ αξρηθώλ απνηειεζκάησλ ηνπ πξνγξάκκαηνο, ηα νπνία ζπδεηνύληαη ζηελ παξάγξαθν απηή. Η πξνζνκνηώζεηο ζαιάζζηνπ θπκαηηζκνύ ειέγρζεθαλ σο ρξεζηκνπνηώληαο έλαλ πισηήξα (buoy) πνπ βξίζθεηαη ζηελ πεξηνρή ηνπ ιηκαληνύ ηεο Hadera ζην Θζξαήι. Σα ζρεηηθά απνηειέζκαηα (βι. Εηθόλα 3) δείρλνπλ εμαηξεηηθή πξνζαξκνγή κεηαμύ κνληέινπ θαη παξαηεξήζεσλ. Εηθόλα 3. ύγθξηζε ύςνπο θύκαηνο κεηαμύ ηνπ κνληέινπ WAM θαη παξαηεξήζεσλ ε όηη αθνξά ηελ πξόγλσζε θπκαηηθήο ελέξγεηαο, ε πξνζνρή καο εζηηάδεηαη ζηηο δύν βαζηθέο παξακέηξνπο πνπ ηελ επεξεάδνπλ: Σν ζεκαληηθό ύςνο θαη ηελ πεξίνδν θπκαηηζκνύ πνπ ππνινγίδνληαη από ην ελεξγεηαθό θάζκα S ηνπ θύκαηνο σο εμήο: 5
 i N Standard Deviation: 2 N 1 X() i 3 i 1 Skewness : N g 1 3 όπνπ είλαη νη ηηκέο ηνπ δείγκαηνο θαη Ν ην κέγεζόο ηνπ.")
108 m H 4 m0 4 S( f ) df s, T m ( 1) m 0 ( 1) 0 0 f 0 1 S( f ) df S( f ) df Οη ζπληζηώζεο απηέο κειεηώληαη σο πξνο ηηο κέζεο ηηκέο, ηηο ηππηθέο απνθιίζεηο θαη ην δείθηε ζπκκεηξίαο ηνπο (skewness): (3) Mean value:, N 1 X() i N Standard Deviation: 2 N 1 X() i 3 i 1 Skewness : N g 1 3 όπνπ είλαη νη ηηκέο ηνπ δείγκαηνο θαη Ν ην κέγεζόο ηνπ. i 1 Η ππό κειέηε πεξηνρή, θαη ηδηαίηεξα ε δπηηθή αθηνγξακκή ηεο Κύπξνπ, ραξαθηεξίδεηαη από κεηαθεξόκελα - κεγάιεο πεξηόδνπ - θύκαηα (κέζε πεξίνδνο κεγαιύηεξε ησλ 5 sec) ε νπνία κάιηζηα εκθαλίδεη ζρεηηθά ρακειή κεηαβιεηόηεηα θαη ηθαλνπνηεηηθή ζπκκεηξία όπσο θαίλεηαη ζηελ Εηθόλα 4. Από ηελ άιιε κεξηά, ην ζεκαληηθό ύςνο θύκαηνο εκθαλίδεη ζρεηηθά ρακειέο ηηκέο ζηελ πεξηνρή κε επίζεο ρακειή κεηαβιεηόηεηα (Εηθόλα 5). Mean Wave Period (sec) St. Deviation of Wave Period Skeweness of Wave Period Εηθόλα 4. Η κέζε ηηκή, ε ηππηθή απόθιηζε θαη ε ζπκκεηξία (skewness) ηεο κέζεο πεξηόδνπ θύκαηνο ζηελ πεξηνρή ελδηαθέξνληνο ηνπ πξνγξάκκαηνο θαηά ηε ρξνληθή πεξίνδν Οθηώβξηνο 2008 Μάξηηνο Mean Significant Wave Height (m) St. Deviation of Sign. Wave Height (m) Skeweness of Sign. Wave Height Εηθόλα 5. Η κέζε ηηκή, ε ηππηθή απόθιηζε θαη ε ζπκκεηξία (skewness) ηνπ ζεκαληηθνύ ύςνπο θύκαηνο ζηελ πεξηνρή ελδηαθέξνληνο ηνπ πξνγξάκκαηνο θαηά ηε ρξνληθή πεξίνδν Οθηώβξηνο 2008 Μάξηηνο Σα παξαπάλσ απνηειέζκαηα νδεγνύλ ζε ηθαλνπνηεηηθέο ηηκέο ελεξγεηαθνύ δπλακηθνύ θαηά κήθνο ηεο δπηηθή αθηήο ηεο Κύπξνπ πνπ βξίζθεηαη θαηά κέζν όξν ζηελ πεξηνρή ησλ 5 kw/m κε πςειέο όκσο ηηκέο κεηαβιεηόηεηαο: 6
 ηνπ ελεξγεηαθνύ δπλακηθνύ ζηελ πεξηνρή ελδηαθέξνληνο ηνπ πξνγξάκκαηνο θαηά ηε ρξνληθή πεξίνδν Οθηώβξηνο 2008 Μάξηηνο 2009.")
109 Mean Wave Energy (kw/m) St. Deviation of Wave Energy (kw/m) Skeweness of of Wave Energy Εηθόλα 6. Η κέζε ηηκή, ε ηππηθή απόθιηζε θαη ε ζπκκεηξία (skewness) ηνπ ελεξγεηαθνύ δπλακηθνύ ζηελ πεξηνρή ελδηαθέξνληνο ηνπ πξνγξάκκαηνο θαηά ηε ρξνληθή πεξίνδν Οθηώβξηνο 2008 Μάξηηνο Οη παξαπάλσ εθηηκώκελεο ηηκέο ελεξγεηαθνύ δπλακηθνύ κειεηήζεθαλ θαη σο πξνο ηελ ζηνραζηηθή ηνπο θαηαλνκή. Πην ζπγθεθξηκέλα, κηα ζεηξά από αλεμάξηεηνπο ειέγρνπο πξνζαξκνγήο απέδεημε όηη ε θαηαλνκή Lognormal, κε ζπλάξηεζε ππθλόηεηαο πηζαλόηεηαο 1 ln x m 2 ( ) 2 v e f( x;, ) (4) xv 2 είλαη απηή πνπ πεξηγξάθεη κε ην βέιηηζην ηξόπν ηα δεδνκέλα γηα ηελ θπκαηηθή ελέξγεηα ζηελ πεξηνρή ηεο Κύπξνπ, όπνπ νη παξάκεηξνη m, v νξίδνληαη από ηελ κέζε ηηκή θαη ηελ ηππηθή απόθιηζε: 2 m ln( ), 2 v ln( ) 2 1 (5) Καιή πξνζαξκνγή εκθάληζε θαη ε Generalized Extreme Value distribution (GEV): 1 1 x 1 (1 k ) k k 1 x f ( x; k,, ) (1 k ) e (6) όπου μ είναι η παράμετροσ θέςησ (location parameter) τησ κατανομήσ, σ η scale και k η shape parameter. Lognormal m-parameter Lognormal v-parameter Εηθόλα 7. Η ρσξηθή θαηαλνκή ησλ παξακέηξσλ ηεο θαηαλνκήο Lognormal 7
110 Εηθόλα 8. Η ρσξηθή θαηαλνκή ησλ παξακέηξσλ ηεο θαηαλνκήο GEV Αμίδεη σζηόζν λα ζεκεησζεί ε ρσξηθή κεηαβιεηόηεηα ησλ ηηκώλ ησλ πξνεγνύκελσλ θαηαλνκώλ (Εηθόλεο 7 θαη 8) γεγνλόο πνπ ζεκαίλεη όηη ζε νπνηνδήπνηε ζύζηεκα βειηηζηνπνίεζεο ή αμηνπνίεζεο ησλ απνηειεζκάησλ απηώλ ζα πξέπεη λα ιακβάλεηαη ππόςε ε αθξηβήο ζέζε ηνπ ζεκείνπ ελδηαθέξνληνο θαη νη αληίζηνηρεο ζπληζηώζεο-παξάκεηξνη ηεο θαηαλνκήο ησλ δεδνκέλσλ θαη λα απνθεύγεηαη ε ρξήζε ρσξηθά νκνηόκνξθσλ ηερληθώλ, όπσο γηα παξάδεηγκα ζπζηήκαηα αθνκνίσζεο δεδνκέλσλ κε ζηαζεξνύο πίλαθεο δηαζπνξάο. 4. ςμπεπάζμαηα Σν πξόγξακκα E-wave είλαη ε ζπληζηακέλε ηεο δνπιεηάο ησλ επηζηεκόλσλ ηνπ Ωθεαλνγξαθηθνύ Κέληξνπ ηεο Κύπξνπ, ηεο Οκάδαο Αξηζκεηηθώλ Μνληέισλ θαη Πξόγλσζεο Καηξνύ ηνπ Παλεπηζηεκίνπ Αζελώλ, ηνπ Ocean Analysis Laboratory ηνπ US-Naval Postgraduate School, ηνπ Ελεξγεηαθνύ Γξαθείνπ Κππξίσλ Πνιηηώλ θαη ηεο Μεηεσξνινγηθήο Τπεξεζίαο ηεο Κύπξνπ ζε ζέκαηα εθηίκεζεο ηνπ ελέξγεηαο πνπ κπνξεί λα παξαρζεί από ηνλ ζαιάζζην θπκαηηζκό ζηελ επξύηεξε ζαιάζζηα πεξηνρή ηεο Κύπξνπ. Γηα ηνλ ζθνπό απηό, εγθαηαζηάζεθαλ ζηα ππνινγηζηηθά ζπζηήκαηα ησλ ζπλεξγαδόκελσλ θνξέσλ δύν κνληέια πξόγλσζεο πεξηβαιινληνινγηθώλ παξακέηξσλ πνιύ πςειήο αθξίβεηαο: Σν αηκνζθαηξηθό κνληέιν Eta/Skiron θαη ην κνληέιν πξόγλσζεο ζαιάζζηνπ θπκαηηζκνύ WAM ηα νπνία εθηέιεζαλ πξνζνκνηώζεηο γηα κία πεξίνδν 10 εηώλ ( ). Επηπιένλ, γηα ηελ ηνπηθή πξνζαξκνγή ησλ απνηειεζκάησλ ηνπ θπκαηηθνύ κνληέινπ ρξεζηκνπνηήζεθαλ θίιηξα Kalman πνπ εμαζθαιίδνπλ ηνλ ζπλππνινγηζκό ησλ ηνπηθώλ ραξαθηεξηζηηθώλ ηεο πεξηνρήο ελδηαθέξνληνο θαη ηελ ειαρηζηνπνίεζε ηπρόλ ζπζηεκαηηθώλ ζθαικάησλ ελώ κία λέα ζηαηηζηηθή δηαδηθαζία αλαπηύρζεθε γηα ηελ εθηίκεζε ηνπ ελεξγεηαθνύ δπλακηθνύ ζηελ πεξηνρή ελδηαθέξνληνο θαη ηελ θαηαλόεζε ηεο ρώξν-ρξνληθήο θαηαλνκήο ηνπ. Οη δξαζηεξηόηεηεο θαη ηα κέρξη ζήκεξα απνηειέζκαηα ηνπ E-wave παξνπζηάδνληαη ζε ηζηνζειίδα πνπ αλαπηύρζεθε εηδηθά γηα ηνπο ζθνπνύο ηνπ έξγνπ: Από ηα κέρξη ζήκεξα, πξνθαηαξθηηθά απνηειέζκαηα, πξνθύπηνπλ ηα εμήο ζπκπεξάζκαηα: Η δπηηθή αθηνγξακκή ηεο Κύπξνπ εκθαλίδεη απμεκέλεο ηηκέο ελεξγεηαθνύ δπλακηθνύ κε ζρεηηθά πςειέο ηηκέο κεηαβιεηόηεηαο. Απηό είλαη απνηέιεζκα ησλ θπκάησλ κεγάιεο πεξηόδνπ (swell) πνπ επηθξαηνύλ ζηελ πεξηνρή. Αμίδεη όκσο λα ζεκεησζεί όηη ηα εθηηκώκελα κεγέζε ηνπ δηαζέζηκνπ ελεξγεηαθνύ δπλακηθνύ είλαη ζαθώο κηθξόηεξα από απηά πνπ εκθαλίδνληαη ζηε Βόξεηα αθηνγξακκή ηεο Επξώπεο, όπνπ εκθαλίδεηαη ζήκεξα ε κεγαιύηεξε θηλεηηθόηεηα ζε ζέκαηα θπκαηηθήο ελέξγεηαο, γεγνλόο πνπ πξέπεη λα ιεθζεί ππόςε γηα ηελ ζσζηή επηινγή ησλ εξγαιείσλ-κεραλώλ παξαγσγήο θπκαηηθήο ελέξγεηαο. Οη θαηαλνκέο πνπ πεξηγξάθνπλ κε ηνλ βέιηηζην ηξόπν ηε ζηνραζηηθή θαηαλνκή ηεο θπκαηηθήο ελέξγεηαο ζηελ πεξηνρή είλαη νη Lognormal θαη Generalized Extreme Value. Οη παξάκεηξνη ησλ πξνεγνύκελσλ θαηαλνκώλ εκθαλίδνπλ ζεκαληηθή ρσξηθή κεηαβιεηόηεηα θάηη πνπ πξέπεη λα ζπλππνινγίδεηαη ζε κειέηεο εθηίκεζεο ησλ κέζσλ αιιά θαη αθξαίσλ ηηκώλ ελέξγεηαο θαζώο θαη ζε ζπζηήκαηα βειηηζηνπνίεζεο ησλ απνηειεζκάησλ. 8
111 Σν πξόγξακκα E-wave αλακέλεηαη λα νινθιεξσζεί κέρξη ην ηέινο ηνπ 2012 κε ηελ αλάπηπμε κηαο ζεηξάο από ειεθηξνληθνύο θαη ζπκβαηηθνύο ράξηεο θαη ηνλ εληνπηζκό πεξηνρώλ κε απμεκέλν ελδηαθέξνλ. Μέζσ ησλ ηερληθώλ εξγαιείσλ θαη κεζνδνινγηώλ πνπ αλαπηύζζνληαη ζηελ θαηεύζπλζε απηή επηδηώθεηαη, επηπιένλ, ε πξναγσγή ηεο επηζηεκνληθήο γλώζεο ζε ζέκαηα κνληεινπνίεζεο αηκνζθαηξηθώλ θαη θπκαηηθώλ παξακέηξσλ θαη εθαξκνγήο ηνπο ζηηο αλαλεώζηκεο πεγέο ελέξγεηαο. Acknowledgments. Η εργαζία ασηή ενηάζζεηαι ζηα πλαίζια ηοσ προγράμμαηος E-wave και τρημαηοδοηείηαι από ηο Ινζηιηούηο Προώθηζης και Έρεσνας ηης Κσπριακής Δημοκραηίας. 5. Βιβλιογπαθικέρ Αναθοπέρ D'Agostino R. B. and Stephens M.A., 1986: Goodness-of-fit Techniques, New York: Marcel Dekker. Bidlot J., Janssen P., Abdalla S. and Hersbach H., A revised formulation of ocean wave dissipation and its model impact. ECMWF Tech. Memo ECMWF, Reading, United Kingdom, 27pp. Crochet P., Adaptive Kalman filtering of 2-metre temperature and10-metre wind-speed forecasts in Iceland, Meteor. Appl., 11, Galanis, G. and Anadranistakis M., A one dimensional Kalman filter for the correction of near surface temperature forecasts, Meteor. Appl. 9, Galanis G., Chu P.C. and Kallos G., Statistical post processes for the improvement of the results of numerical wave prediction models. A combination of Kolmogorov-Zurbenko and Kalman filters, Journal of Operational Oceanography, Vol. 4, No 1, pp Janssen P., ECMWF wave modeling and satellite altimeter wave data. In D. Halpern (Ed.), Satellites, Oceanography and Society, pp , Elsevier. Janssen P., The Interaction of Ocean Waves and Wind. Cambridge, University Press, 300pp. Janssen P. and Onorato M., The Intermediate Water Depth Limit of the Zakharov Equation and Consequences for Wave Prediction. J. Phys. Oceanogr. 37, Janjic, Z. I., The step-mountain eta coordinate model: Further developments of the convection, viscous sublayer, and turbulence closure schemes, Mon. Weather Rev., 122, Kallos G, The Regional weather forecasting system SKIRON. Proceedings, Symposium on Regional Weather Prediction on Parallel Computer Environments, October 1997, Athens, Greece, 9 pp. Kalman, R.E., A new approach to linear filtering and prediction problems, Trans. ASME Ser. D 82, Kalman R.E. and Bucy, R.S., New results in linear filtering and prediction problems, Trans. ASME Ser. D 83, Kalnay, E., 2002, Atmospheric Modeling, Data Assimilation and Predictability, Cambridge University Press, Cambridge, 341pp. Katsafados, P., Factors and parameterizations that determine the performance of limited area models in long-range forecasts, Ph.D. Thesis, School of Physics, University of Athens, Greece, 257pp. Louka P., Galanis G., Siebert N., Kariniotakis G., Katsafados P., Pytharoulis I., and Kallos G., Improvements in wind speed forecasts for wind power prediction purposes using Kalman filtering, Journal of Wind Engineering and Industrial Aerodynamics, Vol.96, Mori N. and Janssen P.A.E.M., On kurtosis and occurrence probability of freak waves, J. Phys. Oceanogr. 36, Papadopoulos, A., Katsafados, P. and Kallos, G., Regional weather forecasting for marine application. Global Atmos. Ocean Syst. 8 (2 3), Pontes M.T., 1998: Assessing the European Wave Energy Resource, Transaction of ASME Vol. 120, pp
112 Geophysical Research Abstracts Vol. 14, EGU , 2012 EGU General Assembly 2012 Author(s) 2012 Near Shore Wave Modeling and applications to wave energy estimation G. Zodiatis (1), G. Galanis (1,2), D. Hayes (1), A. Nikolaidis (1), C. Kalogeri (2), A. Adam (2), G. Kallos (2), and G. Georgiou (1) (1) UNIVERSITY OF CYPRUS, OCEANOGRAPHY CENTRE, Nicosia, Cyprus ), (2) University of Athens, Department of Physics, Atmospheric Modeling and Weather Forecasting Group The estimation of the wave energy potential at the European coastline is receiving increased attention the last years as a result of the adaptation of novel policies in the energy market, the concernsfor global warming and the nuclear energy security problems. Within this framework, numerical wave modeling systems keep a primary role in the accurate description of wave climate and microclimate that is a prerequisite for any wave energy assessment study. In the present work two of the most popular wave models are used for the estimation of the wave parameters at the coastline of Cyprus: The latest parallel version of the wave model WAM (ECMWF version), which employs new parameterization of shallow water effects, and the SWAN model, classically used for near shore wave simulations. The results obtained from the wave models near shores are studied by an energy estimation point of view: The wave parameters that mainly affect the energy temporal and spatial distribution, that is the significant wave height and the mean wave period, are statistically analyzed,focusing onpossible different aspects captured by the two models. Moreover, the wave spectrum distribution prevailing in different areas are discussed contributing, in this way, to the wave energy assessmentin the area. This work is a part of two European projects focusing on the estimation of the wave energy distribution around Europe: The MARINA platform ( index.aspx) and the Ewave ( projects.
113 Numerical wave modeling and wave energy estimation Galanis G. 1,2*, Zodiatis G. 2, Hayes D. 2, Nikolaidis A. 2, Georgiou G. 2, Stylianou S. 2, Kallos G. 1, Kalogeri C. 1, Chu P.C. 3, Charalambous A. 4, Savvidou K. 5, Michaelides S. 5 1 Atmospheric Modeling and Weather Forecasting Group, Department of Physics, University of Athens, University Campus, Building PHYSICS V, Athens, Greece 2 Oceanography Centre, University of Cyprus, P.O. Box 20537, Nicosia, Cyprus 3 Department of Oceanography, Naval Postgraduate School, Monterey, CA 93943, USA 4 Cyprus Energy Agency, 20 Lefkonos str, Strovolos, Nicosia, Cyprus 5 Meteorological Service of Cyprus, 28 Nikis Avenue, Nicosia, Cyprus *corresponding author ggalanis@mg.uoa.gr Abstract In a rapidly evolving operational and research framework concerning the global energy resources, new frontiers have been set for the scientific community working on environmental and renewable energy issues. In particular, new numerical techniques supporting the accurate estimation of renewable energy sources are highly emphasized. In this framework, wave energy - the energy that can be captured from sea waves - provides an alternative option with critical advantages. In the present paper, recent advances and some preliminary results obtained in two European projects will be discussed: Marina platform and E-wave projects are focusing on the estimation of the wave energy potential in North Atlantic coastline of Europe and in Eastern Mediterranean Sea, respectively. Special emphasis is given to the utilization of numerical atmospheric and wave modeling systems able to accurately monitor the atmospheric and sea conditions in the area of interest. On the other hand, advanced statistical techniques are utilized for the local adaptation of the results and the estimation of the spatial and temporal distribution of the wave energy potential. 1 Introduction During the last decade most of the developed European and American countries have set as a primary target the adaptation of novel policies and methodologies
114 2 that will lead to a substantial increase of the use of renewable resources for energy production. The recent global economic crisis further strengthened this political decision leading to a reduced dependence of oil products. Within this framework, the exploitation of wave energy potential, that is the energy produced by the sea waves, seems to be one of the most promising solutions especially for countries with extended coastline like Greece and Cyprus. Wave energy has some critical advantages compared to other renewable sources: it is far more stable than wind power and, therefore, it is easier to be merged into the general grid. Moreover, wave power can be produced even in the absence of local winds by exploiting the swell component of the waves while ecological damages or consequences appear negligible. Still, there are issues that should be taken into consideration in order to ensure the successful exploitation of this type of clean energy: The wave energy potential in the area of interest should be monitored in a credible way and local activities that could be affected (fisheries, touristic companies, marine structures, wildlife, hazards to navigation) must be taken into account. In the present work, the main activities and results of two European projects dealing with wave energy potential estimation are presented. The E-wave project, coordinating by the Oceanography Centre at the University of Cyprus and the MARINA project, in which the Atmospheric Modeling and Weather Foreacting Group of the University of Athens is participating, focusing on the development and application of novel methodologies for the accurate estimation of the wave energy potential in the Mediterranean and the North Atlantic coastline of Europe. Towards this target, state of the art numerical atmospheric and wave simulation systems are utilized while novel statistical approaches are developed and exploited in order to support the credible monitoring of the wave energy potential in the areas of interest. The present work is organized as follows: In Section 2 the main directions and components of the above mentioned projects are presented. The models and the techniques employed are discussed in Section 3, while some first results that have been reached are outlined in Section 4. 2 The projects The primary objectives and methodologies of the Marina and E-wave projects are outlined in this section. Special emphasis is given on the components relevant to the wave power estimation.
115 3 2.1 The E-wave project In January 2011, a research project started in Cyprus focusing on the opportunities for exploitation of wave energy in the Eastern Mediterranean Sea with special emphasis to the Exclusive Economical Zone (EEZ) of Cyprus. The E-wave project is co-funded by the Republic of Cyprus and the European Regional Development Fund of the EU through the National Framework Programme for Research and Technological Development & Innovation by the Research Promotion Foundation of Cyprus. It is coordinated by the Oceanographic Centre (University of Cyprus) while a number of research and operational groups participate: the Atmospheric Modeling and Weather Forecasting Group of the University of Athens, Greece ( the Ocean Analysis Lab - USA Naval Postgraduate School ( the Cyprus Energy Agency ( and the Meteorological Service of Cyprus ( The duration of the project is 24 months. The main aim of E-wave is the development of an integrated, fully operational high resolution system for monitoring the energy potential from sea waves at the EEZ of Cyprus and the wider eastern Levantine basin, coupled with the wellestablished Cyprus Coastal Ocean Forecasting System (CYCOFOS). The new system will include: A complete, high resolution digital atlas consisting of detailed maps for the coastal and offshore areas of the EEZ of Cyprus, in which sea wave and wind climatological characteristics as well as the distribution of the wave energy potential will be monitored. Novel models for the prediction and quantification of wave energy in short and long forecasts, a tool of significant value for grid designers and regulators. More details for the E-wave can be found in the project s web page: The MARINA project The Atmospheric Modeling and Weather Forecasting Group of the University of Athens participates in the Marine Renewable Integrated Application Platform (MARINA) project, with sixteen other research groups and companies from twelve European countries. MARINA project is funded within the 7th Framework Program for R&D of the European Union. The main objective is to support the development of offshore deepwater structures in the Mediterranean and the North Atlantic coastline of Europe that can exploit the energy from wind, wave, tidal and ocean current energy. In particular, research criteria will be defined ensuring the successful integration and develop
, operation and maintenance, and")


116 4 innovative and viable new concepts. In this context a set of solutions are being investigated for: working principle, design, manufacturing, installation (including mooring and grid connection), operation and maintenance, and decommissioning. Fig. 1. The study area of the Ewave and the Marina project. One of the most important effects to be accounted for is the coupling between wind- and wave-induced motions. Non-linear platform mechanics and hydrodynamic effects need to be modeled at different levels of approximation according to the physics of the problem and the accuracy required. MARINA project will contribute in assessing the adequate level of approximation for such applications and will conduct risk assessments like concerning safety, environment and survivability. Further details for the MARINA project can be found in the project s web site: 3 Models and Methodologies The objectives of both projects, described in the previous section, are essentially based on the accurate knowledge of the local wind and wave climate over the area of interest. The main tools that the research community utilizes today to obtain such information are based on physical and statistical numerical models that simulate the wind/wave evolution. Within the framework of the E-wave and the MARINA projects, the atmospheric parameters required for the wind power estimation (e.g., wind speed, turbulence, atmospheric pressure) are provided by the regional atmospheric modeling system SKIRON (Kallos 1997). The high horizontal grid of the model configuration (5km x 5km) allows the detailed description of the atmospheric fields and the provision of highly resolved atmospheric data. Concerning the sea wave simulation, the latest version of the wave model WAM (WAMDIG 1988; Bidlot et al. 2007; Janssen 2000) is utilized at the same resolution. The model provides a number of integrated wave parameters (e.g. the significant wave height, mean and peak wave period, wind driven and swell com-
 and Kalman filters (Eskridge et al. 1997; Rao et al.")
117 5 ponents of the waves) that are crucial for the wave power estimation. Moreover, the full wave spectrum at specific preselected locations is also available. The results of the above numerical models are compiled by a combination of statistical procedures - Kolmogorov-Zurbenko (KZ) and Kalman filters (Eskridge et al. 1997; Rao et al. 1997) - to remove possible biases and provide accurate wind and wave information and resource mapping. The Kalman filter, in particular, recursively combines observations and model simulations based on least square methods. The main advantage is the easy adaptation to new conditions and the limited background information needed. KZ filters, on the other hand, support the homogenization of the time series used and the removal of high frequencies and noisy intervals. 4 Results and Conclusions Some preliminary results obtained within the framework of the MARINA and E-wave projects are presented here focusing on the wave characteristics over the areas under study and the corresponding distribution of the wave energy potential. A first point that is worth noticing is the high accuracy of the wave simulations. A characteristic evaluation is presented in Fig. 2. It concerns the area of Hadera port in Israel where, despite the fact that the observational platform was located very close to the coastline a fact that theoretically poses extra difficulties to an offshore system - the simulated and observed time series are almost identical. Fig. 2. Evaluation of the SWH in the framework of the E-wave project. The blue line corresponds to in-situ observation wave data and the red to the models corresponding outputs Some characteristic results for the main wave parameters that affect the wave power estimation, i.e. the significant wave height and the mean wave period in the NE Levantine area for a period of three months are presented in Fig. 3. Mean SWH (m) Mean Wave Period (sec) Mean Wave Energy (kw/m) Fig. 3. Mean values of Significant Wave Height, Wave Period and Wave Energy
")
 near shores.")
118 6 Increased values of wave energy at the west coastline of Cyprus can be attributed to the prevailing swell waves in the area and the elevated values of Significant Wave Height (SWH). SWH values are well fitted by the Weibull distribution. However, the corresponding shape and scale parameters emerge a non-trivial spatial variation (Figure 4). Shape Parameter Scale Parameter Fig. 4. The shape and scale parameter values of the Weibull distribution The distribution of SWH is close to the usually adopted Rayleigh probability density function (shape parameter 2) near shores. However, it deviates offshore. On the other hand, increased scale parameter values are revealed near Spain and Norway. This spatial distribution is information of potential value for grid designers and researches working on wave energy issues. Acknowledgments This work was supported by the E-wave project (funded by the Research Promotion Foundation of Cyprus, and the MARINA project (7th Framework Programme, Grant agreement number: , References Bidlot JR, Janssen P, Abdalla S, Hersbach H (2007) A revised formulation of ocean wave dissipation and its model impact. ECMWF Tech. Memo ECMWF, Reading, UK 27pp. Eskridge RE, Ku JY, Rao ST, Porter PS, Zurbenko IG (1997) Separating Different Scales of Motion in Time Series of Meteorological Variables, Bul. Amer. Met. Soc., 78(7): Kallos G (1997) The Regional weather forecasting system SKIRON. Proceedings, Symposium on Regional Weather Prediction on Parallel Computer Environments, October 1997, Athens, Greece, 9 pp. Komen GJ, Hasselmann S, Hasselmann K (1984) On the existence of a fully developed windsea spectrum; J. Phys. Oceanogr. 14: Rao ST, Zurbenko IG, Neagu R, Porter PS, Ku JY, Henry RF (1997) Space and Time Scales in Ambient Ozone Data, Bull. Amer. Meteor. Soc. 78(10):
119 Geophysical Research Abstracts Vol. 14, EGU , 2012 EGU General Assembly 2012 Author(s) 2012 Technologies for Online Data Management of Oceanographic Data G. Zodiatis (1), D. Hayes (1), A. Karaolia (1), S. Stylianou (1), A. Nikolaidis (1), I. Constantinou (1), S. Michael (1), G. Galanis (1,2), and G. Georgiou (1) (1) UNIVERSITY OF CYPRUS, OCEANOGRAPHY CENTRE, Nicosia, Cyprus ), (2) Hellenic Naval Academy, Section of Mathematics, Piraeus, Greece The need for efficient and effective on line data management is greatly recognized today by the marine research community. The Cyprus Oceanography Center at the University of Cyprus, realizing this need, is continuously working in this area and has developed a variety of data management and visualization tools which are currently utilized for both the Mediterranean and the Black Sea. Bythos, CYCOFOS and LAS server are three different systems employed by the Oceanography Center, each one dealing with different data sets and processes. Bythos is a rich internet application that combines the latest technologies and enables scientists to search, visualize and download climatological oceanographic data with capabilities of being applied worldwide. CYCOFOS is an operational coastal ocean forecasting and observing system which provides in near real time predictions for sea currents, hydrological characteristics, waves, swells and tides, remote sensing and in-situ data from various remote observing platforms in the Mediterranean Sea, the EEZ and the coastal areas of Cyprus. LAS (Live Access Server) is deployed to present distributed various types of data sets as a unified virtual data base through the use of OpenDap networking. It is first applied for providing an integrated, high resolution system for monitoring the energy potential from sea waves in the Exclusive Economic Zone of Cyprus and the Eastern Mediterranean Levantine Basin. This paper presents the aforementioned technologies as currently adopted by the Cyprus Oceanography Center and describes their utilization that supports both the research and operational activities in the Mediterranean.
, Chu P.C.(3), Charalambous A.(4), Savvidou K.(5), Kountouriotis Z.(5), Michaelides S.(5) 1 University of Cyprus, Oceanography Center, Nicosia 1678, Cyprus, http://www.oceanography.ucy.ac.")


. Moreover, statistical approaches have been developed for the study of the wave energy distribution in the above sea area.")
120 Estimation and monitoring of the wave energy potential in Cyprus Appendix 16 Zodiatis G.(1), Galanis G.(1), Kalogeri C.(2), Nikolaidis A.(1), Stylianou S.(1), Hayes D.(1), Georgiou G.(1), Kallos G.(2), Chu P.C.(3), Charalambous A.(4), Savvidou K.(5), Kountouriotis Z.(5), Michaelides S.(5) 1 University of Cyprus, Oceanography Center, Nicosia 1678, Cyprus, 2University of Athens, Department of Physics, Atmospheric Modeling and Weather Forecasting Group, 3 Naval Postgraduate School, Department of Oceanography, Graduate School of Engineering & Applied Science, Monterey, CA 93943, USA 4 Cyprus Energy Agency, 20 Lefkonos str, Strovolos, Nicosia, Cyprus 5 Cyprus Meteorological Service, 28 Nikis Avenue, Nicosia, Cyprus Temporal Analysis at Selected Locations Introduction In the frame of the E-Wave project, funded by the Cyprus Research Promotion Foundation, the wave energy the energy that can be captured by sea waves is being studied in the sea area of Levantine Basin in the Eastern Mediterranean. The approach adopted is based on the simulation of the sea state over the area of interest by numerical wave modeling systems at a very high temporal and spatial resolution mode for a ten-year period ( ). Moreover, statistical approaches have been developed for the study of the wave energy distribution in the above sea area. The main outcomes of the project is a detailed wave climatology for the Levantine Basin focusing on the wave parameters that directly or indirectly affect the estimation of the available wave energy potential, as well as a series of maps that monitor the distribution of the wave energy itself over the area of interest with special emphasis in the Exclusive Economic Zone of Cyprus. These results provide a solid basis for the study and exploitation of a renewable energy source that, although it is generously provided by the nature, has not been exploited like other clean forms of energy. The study area and the models used For the E-wave project the wave model s domain covered the entire eastern Mediterranean region in order to capture all the swell information that could reach the study area (Levantine) Wave Model WAM The atmospheric system used : SKIRON model SKIRON has been developed at the University of Athens by the Atmospheric Modeling and Weather Forecasting Group based on the Eta/NCEP model. It consists of various modules for pre- and postprocessing together with a version of the Eta model appropriately coded in order to run on any parallel computer platform Is a full physics non-hydrostatic model with sophisticated convective, turbulence and surface energy budget scheme Skiron covered the area with: Horizontal Resolution 0.05 x vertical levels up to 50hPa Initial and boundary conditions: High-resolution reanalysis (15 x 15 Km) ECMWF version of WAM model (Komen et al., 1994, Bidlot J. et al., 2007 ). It is a third generation wave model, which computes spectra of random short-crested wind-generated waves. It is the first model that solves the complete action density equation, including non-linear wave-wave interactions. WAM is mainly used for offshore deep water simulations but the new shallow water scheme of the latest version seems to provide new potential for near-shore modeling too. WAM covered : East Mediterranean (30N 41N, 15E 37E) Horizontal Resolution: 1/60 x 1/60 degrees (~1.667 km). Spectrum discretization 25 frequencies x 24 directions Wind Forcing: SKIRON (10m wind and direction) every 3 hrs Full spectral outputs at preselected locations and integrated wave parameters for the whole domain Statistical Measures The Wave Power density potential for the area under study was estimated by the equation: 2 2 pg Pw pg f E ( f, )dfd 2s Te [W / m] In order to provide a detailed statistical analysis of the obtained wave - energy information the following statistical measures were used 1 N Mean Value: x(i) N i 1 Standard deviation: Skewness: g 1 Kurtosis: g 2 1 N 2 x(i) N i 1 1 N 3 x(i ) N i N 4 x(i ) N i 1 extreme values. 4 1 The modeled data were analyzed by a variety of statistical measures providing information not only for the most frequent values and their deviation but also for the symmetry of the data and their exposure to extreme events. Probability density functions (pdf) were fitted to the estimated wave power data in order to clarify the statistical distribution that optimally describes them. The areas with increased wave power potential are that of western and southern sea regions of the Cyprus Relatively low but exploitable amount of energy have been monitored characterized by positive skeweness-assymetry (concentration in values lower than the mean) with a medium standard deviation and positive kurtosis revealing possible influence from infrequent deviations. The lognormal distribution 𝑓(𝑥; 𝜇, 𝜎) = 𝑒 1 ln 𝑥 𝜇 2 2 𝜎 𝑥𝜎 2𝜋 is optimally fitted to the modeled wave power data for the period October-March while during the period April Septemberand the Generalized Extreme Values (GEV) distribution prevails 𝑓 𝑥; 𝑘, 𝜇, 𝜎 = 1 𝜎 x 𝜇 𝑘 1 x 𝜇 𝑘 1+𝑘 𝜎 𝑘 𝑒. 𝜎 Τhe corresponding shape and scale parameters have a non trivial spatial variation, a typical variation index, a measure of the asymmetry of the probability distribution. 3, as a measure of the "peakedness" of the probability distribution and the impact of possible Lognormal μ-parameter Lognormal σ-parameter GEV k-parameter GEV μ-parameter GEV σ-parameter The prevailing wind/waves are from the western sector as the 10 years study indicates Loc 1 is situated in a more sheltered area with a quite different behavior compared to Loc 2 which is open to the prevailing wind/waves. This characteristics are depicted by the model as the wind/wave roses, Pdfs and joint probability distribution plots indicate. The Lognormal (3parameters) pdf fits satisfactory the Hs and Tenergy for the two sites with slightly different parameters. References Bidlot J., Janssen P., Abdalla S. and Hersbach H., A revised formulation of ocean wave dissipation and its model impact. ECMWF Tech. Memo ECMWF, Reading, United Kingdom, 27pp. Emmanouil G., Galanis G., Kallos G., Breivik L.A., Heilberg H., Reistad M., 2007: Assimilation of radar altimeter data in numerical wave models: An impact study in two different wave climate regions, Annales Geophysicae 25 (3), Galanis G., Chu P.C. and Kallos G., Statistical post processes for the improvement of the results of numerical wave prediction models. A combination of Kolmogorov-Zurbenko and Kalman filters, Journal of Operational Oceanography, Vol. 4, No 1, pp Janssen P., ECMWF wave modeling and satellite altimeter wave data. In D. Halpern (Ed.), Satellites, Oceanography and Society, pp , Elsevier. Janssen P., The Interaction of Ocean Waves and Wind. Cambridge, University Press, 300pp. Kallos G, The Regional weather forecasting system SKIRON. Proceedings, Symposium on Regional Weather Prediction on Parallel Computer Environments, October 1997, Athens, Greece, 9 pp. Kalnay, E., 2002, Atmospheric Modeling, Data Assimilation and Predictability, Cambridge University Press, Cambridge, 341pp. Komen G., Cavaleri L., Donelan M., Hasselmann K., Hasselmann S., Janssen P.A.E.M., 1994: Dynamics and Modelling of ocean waves, Cambridge University Press. Mori N. and Janssen P.A.E.M., On kurtosis and occurrence probability of freak waves, J. Phys. Oceanogr. 36, Papadopoulos, A., Katsafados, P. and Kallos, G., Regional weather forecasting for marine application. Global Atmos. Ocean Syst. 8 (2 3), Pontes M.T., 1998: Assessing the European Wave Energy Resource, Transaction of ASME Vol. 120, pp Acknowledgments: The present work is supported by the E-WAVE project funded by the Research Promotion Foundation of the Republic of Cyprus and the European Regional Development Fund.


121 Estimation and Monitoring of Wind/Wave energy potential in the Eastern Mediterranean Sea George Zodiatis1, George Galanis1,2, George Emmanouil1,2, Dan Hayes1, Andreas Nikolaidis1, Georgios Georgiou1, Christina Kalogeri3 and George Kallos3 Appendix Hellenic Hellenic Naval 3University Academy University of Cyprus, Oceanography Center, Nicosia 1678, Cyprus Naval Academy, Section of Mathematics, Hatzikyriakion Piraeus , Greece of Athens, Department of Physics, Atmospheric Modeling and Weather Forecasting Group 3 Introduction Statistical Analysis Τhe adaptation and use of innovative methodologies for the exploitation of renewable energy marine resources is one of the main issues today for the environmental science community. Within this framework, the exploitation of wind and wave energy potential for coastal and island states seems to be one of the promising solutions and highly interesting from research and technological point of view. In this work, the activities of two projects focusing on the study of wind/wave energy over the area of Eastern Mediterranean Sea are presented. The Integrated High Resolution System for Monitoring and Quantifying the Wave Energy Potential in the Exclusive Economical Zone (EEZ) of Cyprus (Ewave project) focuses on the estimation, monitoring and forecasting of the wave energy potential over the Levantine Basin with special emphasis to the ΕΕΖ of Cyprus, while the Development and application of new mathematical and physical models for Monitoring the wind and Sea wave Energy Potential (MOSEP project) is a platform for developing new mathematical algorithms for the estimation of the wave energy over the Aegean Sea. In both projects, high resolution digital atlases of sea wave/wind climatological characteristics and the distribution of the wind and wave energy potential are developed for the coastal and offshore areas of the East Mediterranean sea. Moreover, new models for the prediction and quantification of wave energy in short and long forecast horizons are proposed. Statistical results concerning the probability density functions of the wind speed, the significant wave height, as well as the energy potential will be presented for selected sea areas in the Eastern Mediterranean Sea, while test case studies in certain regions, favor to wind/wave renewable energy will be discussed. The study area and the models used parameters obtained in the framework of the two projects 1 N Mean Value: x(i ), N denoting the sample size N i 1 Standard deviation: 1 N 2 x(i) N i 1, a typical variation index 1 N 4 x(i) N i 1 3, the fourth moment of the data under study, that gives a measure of the Kurtosis: g 2 4 "peakedness" of the probability distribution and the impact of possible extreme values. On the other hand, the wind and wave data in study have been approached by a probability density function (pdf) point of view, being fitted to a number of probability density functions, in order to define the optimal statistical distribution that describes them. The following pdfs have been employed: Logistic, Normal, Gamma, Log-Gamma, LogLogistic, Lognormal, Weibull, Generalized Logistic. Wave Energy monitoring in Levantine Sea by the Ewave project The prevailing wind/waves are from the western sector as the 10 years study indicates eastern Mediterranean region, in order to capture the long The site studied is exposed to the prevailing wind/waves, a fact well simulated by the model and depicted in the wind/wave roses. period waves that may reach the study areas (Levantine and The Weibull and Lognormal 3-parameter distributions optimally fit to the significant wave height and energy period values. Aegean Sea) The Lognormal (3parameters) pdf fits satisfactory the Hs and Tenergy for the two sites. Temporal Analysis at Selected Locations MOSEP The atmospheric system: WRF-ARW model (MOSEP) SKIRON has been developed at the University of Athens, by the Atmospheric Modeling and Weather Forecasting Group, based on the Eta/NCEP model. Is a full physics non-hydrostatic model with sophisticated convective, turbulence and surface energy budget scheme Horizontal Resolution 0.05 x vertical levels up to 50hPa Initial and boundary conditions: High-resolution reanalysis (15 x 15 Km) The following statistical indices have been used for the analysis of the modelled data of power and environmental For both projects, the model s domain covered the entire The atmospheric system SKIRON (E-Wave) WRF has been a collaborative partnership, among NCAR, NOAA-NCEP and other US military Laboratories (FSL, AFWA, NRL) and Universities a next-generation mesoscale numerical weather prediction system, for both operational forecasting and atmospheric research suitable for a broad spectrum of applications from meters to thousands of kilometers. Horizontal Resolution 0.02 x 0.02 (inner grid) 35 vertical levels up to 50hPa Initial and boundary conditions: GFS high-resolution reanalysis (15 x 15 Km) ECMWF version of WAM model (Komen et al., 1994, Bidlot J. et al., 2007 ). It is a third generation wave model, which computes spectra of random short-crested wind-generated waves. It is the first model that solves the complete action density equation, including non-linear wave-wave interactions. East Mediterranean (30N 41N, 15E 37E) Horizontal Resolution: 1/60 x 1/60 degrees (~1.667 km) for the Ewave project and 0.05x0.05 degrees for the MOSEP project Wind Forcing (10m wind and direction) every 3 hrs: Spectrum discretization 25 frequencies x 24 directions E-Wave: SKIRON MOSEP: WRF-ARW Wind and Wave Power Estimation A variety of statistical indices have been utilized for the analysis of the modeled data providing information for the most frequent values, their deviation as well as for the impact of possible extreme events. The available (theoretical) potential for Wind Power is estimated as The swell dominated western and southern sea areas of the Cyprus seas seem to keep the primary role in wave power [W ] potential (2.5 kw/m). where ρ stands for the air density and v for the wind speed. Although the amount of the estimated power is low, it is still exploitable since it is characterized by medium The Wave Power density potential for the area of study is estimated by Pw pg pg f 1E ( f, )dfd 2s Te 64 The Hs modeled data is described well by a Weibull distribution, but the lognormal 3P pdf is the optimal uncertainty and positive kurtosis revealing possible influence from infrequent deviations. [W / m] where E(f,θ) is the 2-dimensional wave spectrum, Hs the significant wave height and Te the mean energy wave period. The joint probability distribution of Hs and Te reveals that the most frequent values of Hs and Te are References WAM setup (E-Wave & MOSEP): 1 3 v 2 around 0.5 m and 3-5 sec respectively. WAM is mainly used for offshore deep water simulations but the new shallow water scheme of the latest version seems to provide new potential for near-shore modeling too. Pwi The area studied is dominated by wind waves coming mainly from north directions. choice. Wave Model WAM Temporal Analysis at Selected Locations E-Wave The spatial variability of kurtosis values reveals the key role that high resolution studies have. The significant wave height values have a non trivial decadal variation with increased kurtosis and standard deviation. The mean (energy) wave period is more stable and normally distributed. Bidlot J., Janssen P., Abdalla S. and Hersbach H., A revised formulation of ocean wave dissipation and its model impact. ECMWF Tech. Memo ECMWF, Reading, United Kingdom, 27pp. Emmanouil G., Galanis G., Kallos G., Breivik L.A., Heilberg H., Reistad M., 2007: Assimilation of radar altimeter data in numerical wave models: An impact study in two different wave climate regions, Annales Geophysicae 25 (3), Galanis G, Emmanouil G, Kallos G, Chu PC, 2009: A new methodology for the extension of the impact in sea wave assimilation systems, Ocean Dynamics, 59 (3), Galanis G., Chu P.C. and Kallos G., Statistical post processes for the improvement of the results of numerical wave prediction models. A combination of Kolmogorov-Zurbenko and Kalman filters, Journal of Operational Oceanography, Vol. 4, No 1, pp Janssen P., ECMWF wave modeling and satellite altimeter wave data. In D. Halpern (Ed.), Satellites, Oceanography and Society, pp , Elsevier. Janssen P., The Interaction of Ocean Waves and Wind. Cambridge, University Press, 300pp. Kallos G, The Regional weather forecasting system SKIRON. Proceedings, Symposium on Regional Weather Prediction on Parallel Computer Environments, October 1997, Athens, Greece, 9 pp. Kalnay, E., 2002, Atmospheric Modeling, Data Assimilation and Predictability, Cambridge University Press, Cambridge, 341pp. Komen G., Cavaleri L., Donelan M., Hasselmann K., Hasselmann S., Janssen P.A.E.M., 1994: Dynamics and Modelling of ocean waves, Cambridge University Press. Mori N. and Janssen P.A.E.M., On kurtosis and occurrence probability of freak waves, J. Phys. Oceanogr. 36, Papadopoulos, A., Katsafados, P., Kallos, G., Regional weather forecasting for marine application. Global Atmos. Ocean Syst. 8, Pontes M.T., 1998: Assessing the European Wave Energy Resource, Transaction of ASME Vol. 120, pp WAMDIG, The WAM-Development and Implementation Group: Hasselmann S, Hasselmann K, Bauer E, Bertotti L, Cardone CV, Ewing JA, Greenwood JA, Guillaume A, Janssen P, Komen G, Lionello P, Reistad M, Zambresky L (1988) The WAM Model - a third generation ocean wave prediction model, Journal of Physical Oceanography, 18 (12), Acknowledgments: The present work is supported by the E-WAVE project (funded by the Research Promotion Foundation of the Republic of Cyprus and the European Regional Development Fund) and by the MOSEP project (funded by the General Secretariat of Research and Technology of Greece and the European Regional Development Fund)

 has been providing operational wave forecasts in the Mediterranean and Black")


 has been adopted renewable energy applications aqua culture Sea surface current information from the CYCOFOS and MFS-OPA (Pinardi et al.")

122 CYCOFOS new wave forecasting system incorporating sea currents George Appendix 18 2University 1,2 Galanis, 1 Zodiatis, 1 Hayes, 1 Nikolaidis George Dan Andreas and George 1 University of Cyprus, Oceanography Center, Nicosia 1678, Cyprus 2 Kallos University of Athens, Atmospheric Modeling and Weather Forecasting Group of Athens, Department of Physics, Atmospheric Modeling and Weather Forecasting Group ggalanis@mg.uoa.gr Wave Modeling at the Oceanography Center of Cyprus The Cyprus Coastal Ocean Forecasting and Observing System (CYCOFOS) has been providing operational wave forecasts in the Mediterranean and Black sea since 2002 (Zodiatis et al. 2003) covering a number of research and operational activities: The latest parallel version of the wave model WAM (ECMWF version, cycle 33R1) has been adopted. Recently the CYCOFOS wave system has been updated and modified in order to provide higher resolution sea surface wave predictions at basin, sub-basin and coastal scales, minimizing, at the same time, the demanded computational cost. Towards this The new model includes: A novel advection scheme extended so to account for the corner points of the grid boxes based on the Corner Transport Upstream scheme leading to a more uniform propagation of wave spectra in all directions (Bidlot, J. and Janssen, P. 2003). New procedures for the estimation of the maximum expected wave height by means of the probability distribution of sea surface elevation Increased horizontal resolution of the wind input (SKIRON/Eta system) at 0.05x0.05 degrees Wave-Current interaction Increased resolution of the restart files Dynamically determined time step direction, the following actions have been taken: SAR support wave climate ship traffic A new version of the wave model WAM (Bidlot, J. and Janssen, P. 2003; Komen G. et. el. 1994; WAMDIG, 1988) has been adopted renewable energy applications aqua culture Sea surface current information from the CYCOFOS and MFS-OPA (Pinardi et al., 2003) ocean forecasting systems has been marine pollution tourist activities marine safety The new wave model Recent Developments Updates The CYCOFOS system incorporated in the wave integration, providing a second independent forcing input for the wave model in addition to the wind speed offshore exploration and direction The resolution of both the wave model and the wind input (provided by the SKIRON/ETA weather forecasting system) has been increased (Kallos G., 1997; Papadopoulos et. al., 2001) Main Model Outputs Areas Covered Grid Area covered Mediterranean and Black Sea 6.0 W 42.0 E 29N - 47 N Levantine 27.5 E 36.5 E 30 N - 38 N Cyprus Resolution (degrees) Wind input and resolution Bathymetry data Spatial: 0.05 x 0.05 Wave spectrum discretized to 25 frequencies 24 directions 10m wind speed Spatial: x and direction Wave spectrum discretized to 25 frequencies 24 directions 31.0 E 36.5 E Spatial: x N - 37 N Wave spectrum discretized to 25 frequencies 24 directions Forecast Horizon Significant wave height & direction Mean & peak wave period Maximum expected wave height Mean swell and wind driven period Swell height and direction Mean directional spread Wind driven wave height and direction Wind speed & direction at sea level 1-hourly Skiron/Eta non hydrostatic forecasting system Wave-Current interaction Apart from the wind forcing, surface sea currents are also NOAA ETOPO 1 (1-minute) assimilation scheme (3DVAR) (Dobricic and Pinardi, utilized 108 hours (one forecast cycle per day) MOON system consists of a numerical model and a data The two horizontal components of the surface sea currents 2008) capable of assimilating satellite and in situ data (0.05 x 0.05 degrees at a resolution of 1/16 degrees were provided by the MFS is forced by atmospheric input produced by the horizontal resolution) Mediterranean Operational Oceanography Network European Center for Medium range Weather Forecasts MOON basin system, known also as Mediterranean (ECMWF) analyses and forecasts (ECMWF, 2005) at Forecasting System-MFS (Pinardi et al., 2003) 0.5x0.5 degrees and 6 hours resolution Statistical Analysis Evaluation of the models Methodology Seasonal Spatial distribution of statistical parameters for the wave height over the Med Sea Two versions of the model was employed for a period of one year (2009) The impact of the currents (WAMC) on the model simulation is limited. One using as external forcing only the wind speed and direction (WAM) A second in which surface sea currents were also utilized (WAMC) It results to a moderate increase of the mean significant wave height values and of the The results were evaluated against satellite data.: corresponding variability at specific areas (like Southern France coastline) especially during Gridded observational records from the ESA-CNES joint project Radar Altimetry Tutorial were used (Rosmorduc winter months. et. al., 2009). Elevated kurtosis values are present in the model results during the summer period revealing These are near-real time observations for significant wave height obtained by merging all available relevant increased influence of extreme values on the variability of the forecasts. satellite records from a variety of data centers: ERS-1 and ERS-2 (ESA), Topex/Poseidon (NASA/CNES), Geosat The western Mediterranean part indicates more non-uniform distributions of significant wave Follow-On (US Navy), Jason-1 (CNES/NASA), Envisat (ESA). height (both from a skeweness and a kurtosis point of view). The last two days of available data for each satellite are employed and a merged map is generated if a minimum of two missions is available. The Levantine region is affected mainly during the autumn period when both the models and The final outputs are obtained by means of interpolation and cover the area of study for the year 2009 at a the observations coincide on particularly increased values for the two asymmetry measures. resolution of 0.25 degrees. Cross-calibration and quality control of the data are performed using Jason-1 as the reference mission References Monthly variation of the statistical parameters for the wave height over the Levantine This bias is improved, at least partly, by the use of sea currents. Bidlot, J. and Janssen, P. 2003: Unresolved bathymetry, neutral winds and new stress tables in WAM. ECMWF Research Department Memo R60.9/JB/0400. Dobricic, S. and N.Pinardi, 2008.: An oceanographic three-dimensional variational data assimilation scheme, Ocean modelling, 22: Kallos, G., 1997: The Regional weather forecasting system SKIRON. Proceedings, Symposium on Regional Weather Prediction on Parallel Computer Environments, October 1997, Athens, Greece, 9 pp. Komen G., Cavaleri L., Donelan M., Hasselmann K., Hasselmann S., Janssen P.A.E.M., 1994: Dynamics and Modelling of ocean waves, Cambridge University Press. Papadopoulos, A., P. Katsafados, and G. Kallos, 2001: Regional weather forecasting for marine application. Global Atmos. Ocean Syst., 8, No 2-3, Pinardi, N., I. Allen, P. De Mey, G. Korres, A. Lascaratos, P.Y. Le Traon, C. Maillard, G. Manzella and C. Tziavos, The Mediterranean ocean Forecasting System: first phase of implementation ( ). Ann. Geophys., 21, 1, Rosmorduc, V., Benveniste J., Lauret O., Maheu C., Milagro M., Picot N., 2009: Radar Altimetry Tutorial, J. Benveniste and N. Picot Ed., WAMDIG: The WAM-Development and Implementation Group,1988: S.Hasselmann, K. Hasselmann,E. Bauer, L. Bertotti, C. V. Cardone, J. A. Ewing, J. A. Greenwood, A. Guillaume, P. A. E. M. Janssen, G. J. Komen, P. Lionello, M. Reistad, and L. Zambresky: The WAM Model - a third generation ocean wave prediction model, J. Phys. Oceanogr., Vol. 18, No. 12, pp, Zodiatis G., Lardner R., Georgiou G., Demirov E., Pinardi N., Manzella G. (2003). The Cyprus coastal ocean forecasting and observing system, a key component in the growing network of European ocean observing systems, Sea Technology, v.44, n.10, Model results (both with and without currents) are more variable and asymmetric especially during the winter months, compared to the satellite measurements. Acknowledgments: This work is supported by the E-WAVE project funded by the Research Promotion Foundation of the Republic of Cyprus and the European Regional Development Fund. The model generally underestimates the wave height, especially in winter.
123
124 Evaluation of High Resolution Wave Simulations with SAR-Observations and Estimation of the Wave Power Potential Spatiotemporal Distribution George Kallos (1), Christine Kalogeri (1), Alexandros Adam (1), George Galanis (1) (1) University of Athens, GR Abstract The use of numerical wave modeling systems for monitoring and estimating renewable energy resources is receiving increased attention as a result of the novel policies adopted in the energy market. In this framework, the MARINA Platform and the E-wave projects*, bridging leading European research groups and companies activated on the exploitation of renewable energy resources, provide novel products and methodologies for the estimation and exploitation of the wave power potential and the evaluation of multi-purpose platforms for marine renewable energy. One of the main outcomes of the above projects is a ten-year ( ) data base of high resolution atmospheric and wave parameters that are used for monitoring the distribution of wind and wave power potential over different areas of the European coastline. Satellite measurements are of significant importance in this context since they can be utilized for the optimization and evaluation of model results. In the present work, the modeled results obtained within the framework of the MARINA and the E-wave projects are evaluated against SAR observations focusing mainly on the behavior of the wave parameters that directly or indirectly affect the wave energy potential as well as the stochastic distribution of the latter. 50
125 Appendix 21 E-Wave: Integrated High Resolution System for Monitoring and Quantifying the Wave Energy Potential in the EEZ of Cyprus The wave model WAM at the US NPS computer system Technical Report June 2011

126 I. The US-NPS computer system A new super computer system consisting of more than 1000 CPUs has been established in the Naval Postgraduate School (NPS), Monterey, USA. The Ocean Analysis and Prediction Laboratory has reserved the necessary resources for supporting the activities of the E-wave project and, in particular, the 10-year wave simulation covering the seas of Cyprus. In this section the main characteristics of this system are presented. I.a. System characteristics The new NPS computer system (Hamming) is a multiuser cluster with many different capabilities. It consists of 144 nodes with 8 cores available per node resulting to 1152 processing cores in total. There are 8 GB of ram available per node (1.17 TB ram in total) as well as 112 TB raw disk storage. Different file systems are available (LUSTRE and ZFS) whose main structure is presented in diagram 1. Diagram 1. Available file systems in NPS cluster (
127 The operating system is UNIX enriched with a number of different programming and operational capabilities: PGI, Intel, SUN, and GCC compilers MPICH, MPICH2, Open-MPI parallelization libraries I.b. Working on the NPS cluster In order to make sure peoples jobs do not collide with each other, Hamming uses the Portable Batch System, PBS. This is a workload management system for Linux clusters. It supplies commands to submit, monitor, and delete jobs. The main available components are: Job Scheduler - a daemon that contains the site's policy controlling which job is run, where and when it is run. In particular, the TORQUE Resource Manager is used. Torque provides control over batch jobs and distributed computing resources. It incorporates significant advances in the areas of scalability, reliability, and functionality and is currently in use at tens of thousands of leading government, academic, and commercial sites throughout the world. Job Server - also called pbs_server provides the basic batch services such as receiving/creating a batch job, modifying the job, protecting the job against system crashes, and running the job. Job Executor - a daemon (pbs_mom) that actually places the job into execution when it receives a copy of the job from the Job Server. Mom creates a new session as identical to a user login session as is possible and returns the job's output to the user. Below are the steps needed to run a job: 1. Create a job script containing the following PBS options: o request the resources that will be needed (i.e. number of processors, wall-clock time, etc.) o prepare for execution of the executable (i.e. change to working directory, etc.). 2. Submit the job script file to PBS. 3. Monitor the job.
128 TORQUE Options Below are some of the commonly used options in a job script file. The options start with "#PBS." Option #PBS -N myjob #PBS -l nodes=4:ppn=2 #PBS -q queuename #PBS -l walltime=01:00:00 #PBS -o mypath/my.out #PBS -e mypath/my.err #PBS -j oe #PBS -m b #PBS -m e #PBS -m a Description Assigns a job name. The default is the name of PBS job script. The number of nodes and processors per node. Assigns the queue your job will use. The maximum wall-clock time during which this job can run. The path and file name for standard output. The path and file name for standard error. Join option that merges the standard error stream with the standard output stream of the job. Sends mail to the user when the job begins. Sends mail to the user when the job ends. Sends mail to the user when job aborts (with an error). Allows a user to have more than one command with the same #PBS -m ba #PBS -r n #PBS V flag by grouping the messages together on one line, else only the last command gets executed. Indicates that a job should not rerun if it fails. Exports all environment variables to the job. TORQUE environmental variables There are a number of predefined environment variables. These include the following: o o o Variables defined on the execution host; Variables exported from the submission host to the execution host; and Variables defined by Torque. The following environment variables relate to the submission machine:
129 Option PBS_O_HOST Description The host machine on which the qsub command was run. PBS_O_LOGNAME The login name on the machine on which the qsub was run. PBS_O_HOME PBS_O_WORKDIR PBS_O_HOST PBS_O_LANG PBS_O_MAIL PBS_O_WORKDIR PBS_O_PATH PBS_O_LOGNAME The value of the HOME variable in the environment in which qsub was executed. The working directory from which the qsub was run. The name of the host upon which the qsub command is running. The value of the LANG variable in the environment in which qsub was executed. The value of the MAIL variable in the environment in which qsub was executed. The absolute path of the current working directory of the qsub command. The value of the PATH variable in the environment in which qsub was executed. The value of the LOGNAME variable in the environment in which qsub was executed. The following variables relate to the environment where the job is executing: Option PBS_ENVIRONMENT PBS_O_QUEUE PBS_JOBID PBS_JOBNAME PBS_NODEFILE PBS_NODENUM PBS_O_SHELL PBS_QUEUE PBS_TASKNUM PBS_VNODENUM Description This is set to PBS_BATCH for batch jobs and to PBS_INTERACTIVE for interactive jobs. The original queue to which the job was submitted. The identifier the batch system assigned to the job. The name of the job. The file containing the list of nodes assigned to a parallel job. Zero (0) based count of node The value of the SHELL variable in the environment in which qsub was executed. Queue the job is running in TaskNumber VirtualNodenumber
130 Job Script Template A job script may consist of PBS directives, comments and executable statements. A PBS directive provides a way of specifying job attributes in addition to the command line options. For example: #PBS -N Job_name #PBS -l walltime=10:30,pmem=320kb #PBS -m be step1 arg1 arg2 step2 arg3 arg4 Submitting a Job Use the qsub command to submit the job. Option -a date_time qsub [options] joba Description Define the time at which a batch job becomes eligible for execution -c interval Define whether the batch job should be check pointed, and if so, how often. -h Specify that a USER hold is applied to the batch job. -N name Define the name of the batch job. -o file Define the path/filename for the standard output of the batch job. -q queue Define the destination queue of the batch job. -V Specify that all of the environment variables of the process are exported to the context of the batch job. PBS assigns a job a unique job identifier once it is submitted (e.g. 123.cluster0). After a job has been queued, it is selected for execution based on the resources required and available. Monitoring a job Command qstat -a qstat -f qdeljob.id qholdjob.id qrlsjob.id pbsnodes Tracejobjob.ID xpbsmon Function check status of jobs, queues, and the PBS server get all the information about a job, i.e. resources requested, resource limits, owner, source, destination, queue, etc. delete a job from the queue hold a job if it is in the queue release a job from hold Show the status of the nodes in the cluster Show the status of a given job GUI showing status of nodes (see pbsnodes)
131 II. The wave system. II a. The WAM model. The wave model WAM (WAMDIG, 1988; Komen et al., 1994) is a third generation wave model which solves the wave transport equation explicitly without any presumptions on the shape of the wave spectrum. It represents the physics of the wave evolution in accordance with our current knowledge and uses the full set of degrees of freedom of a 2d wave spectrum. The model runs for any given regional or global grid with a prescribed bathymetric dataset. The grid resolution can be arbitrary in space and time. The propagation can be done on a latitudinal longitudinal or on a Cartesian grid. The model can run for deep and shallow water (from the abyssal seas up to a few meters) and includes the effect of wave refraction from changes in depth and from ocean currents. The integration can be interrupted and restarted at arbitrary times. In the framework of the E-wave project, the ECMWF version, CY33R1 (Jansen, 2000; Bidlot and Janssen, 2003) has been adopted. This new version contains a number of important updates that increase significantly the potential capabilities of the wave system. In particular, the following improvements, comparing to older WAM systems, have been adopted: 1. A new advection scheme is used by the introduction of contributions from the corner points. More precisely, in older versions the wave energy balance equation F ( ugf) ( vgf) 0, t x y where F is the wave variance spectrum and (u g,v g ) the group speed, was solved using a first order upwinding scheme considering contributions from neighboring points only in x and y directions ignoring the corners of the grid used in the local calculation. In this way, no contributions from the corners of the grid were considered. In the new version of the model the advection scheme is extended to account also for the corner points by using the Corner Transport Upstream scheme providing a more uniform propagation in all directions.
132 2. Following the work of Janssen and Onorato (2007), a new parametrization of shallow water effects is introduced that affects both the time evolution of the wave spectrum and the determination of the kurtosis of the wave field. 3. Two extreme wave parameters have been introduced, namely the average maximum wave height and the corresponding wave period. Following the work of Mori and Janssen (2006), it is suggested to use the maximum wave height, observed during a period of length T as an indicator of how extreme the sea state is. For a known probability distribution of the sea surface elevation it is shown how to obtain an estimate of the average maximum wave height. 4. A number of technical modifications have been made, concerning the way that the minimum time step can be defined, and has proven valuable for the use of the model in high resolution grids. 5. The spatial resolution of the Limited Area Wave (LAW) model has been increased from 28 to 10 km. II b. Model s configuration for the E-wave project. The above described new version of the WAM model has been set up at the NPS cluster. The model domains cover the eastern part of the Mediterranean Sea: 30N 41N, 15E 37E (Fig. 1) so to capture all the necessary swell information that will guarantee the correct wave simulation in the area of Levantine: 30.0 N N, 27.5 E 36.5 E (red rectangle in Fig. 1) which is the main area of interest. Figure 1. E-wave domains
133 In order to take into account in a credible and detailed way all the local characteristics, a very high horizontal resolution has been adopted (1/60 x 1/60 degrees the highest of all research or operational models running presently at this area). The wave spectrum was discretized to 25 frequencies (range Hz logarithmically spaced) and 24 directions (equally spaced) while the propagation time step has been set to 45 seconds, a rather high value resulting to increased integration time, but necessary in order to meet the CFL stability criterion s standards. The main wave model characteristics are summarized in the Table 1. WAM is operated on a deep water mode, driven by 3-hourly wind input (10 m wind speed and direction) obtained from the SKIRON regional atmospheric system (Kallos, 1997; Papadopoulos et al., 2001). The horizontal resolution used for the SKIRON model coincides with that of the wave model while 45 vertical levels stretching from surface to 20 Km altitude are employed. The atmospheric system uses NCEP/GFS 0.5x0.5 degrees resolution fields for initial and boundary conditions. The necessary sea surface boundary conditions are interpolated from the 0.5x0.5 degrees SST (Sea Surface Temperature) field analysis retrieved from NCEP on daily basis. Vegetation and topography data are applied at a resolution of 30 seconds and soil texture data with resolution of 120 seconds. Wave model WAM, ECMWF version, CY33R1 Area covered 30N 41N, 15E 37E Horizontal Resolution 1/60 x 1/60 degrees ( km approximately) Frequencies 25 (range Hz logarithmically spaced) Directions 24 (equally spaced) Timestep 45 sec Wind forcing SKIRON atmospheric model Wind forcing time step 3 hours Table 1. The configuration of the wave model. The model has been setup on the machine and, more precisely, at chu@ :/work/chu/wam_cyp/ The run of the model is supervised by the script /work/chu/wam_cyp/wam_oper which is included in this report in appendix A.
134 The main model run is followed by a number of post processes ensuring the visualization and backup of the results. All these procedures are supervised by the script /work/chu/wam_cyp/pb_script that is presented in the appendix B. The model outputs cover a wide range of wave parameters and components. More precisely, for each grid point of the domain, the following data are provided: S_WHT = Significant Wave Height in m MEANWDIR = Mean Wave Direction in deg (meteorological convention) PEAK_FR = Peak Frequency in Hz MEAN_FR = Mean Frequency in Hz USTAR = Friction Velocity in m/sec WIND_DIR = Wind Direction in deg CDG = Drag Coefficient WIND_SPEED = Wind Speed at 10m in m/sec DEPTH = Model Bathymetry in m MAXWH = Maximum Wave Height in m MAXWP = Maximum Wave Period in sec SWE_H = Swell Wave Height in m MEANSDIR = Mean Swell Direction in deg (meteorologcal convention) MEANSFR = Mean Swell Frequency in Hz WSEA_H = Wind Sea Wave Height in m WSEAD = Wind Sea Direction in deg WSEA_FR = Wind Sea Frequency in Hz MSP1 = Mean Swell Period 1 in sec MSP2 = Mean Swell Period 2 in sec MWSEAP1 = Mean Wind Sea Period 1 in sec MWSEAP2 = Mean Wind Sea Period 2 in sec
135 APPENDIX A The script that supervises the operational run of the wave model #!/bin/csh #PBS -N wam_oper ##PBS -o Job_Output.txt #PBS -l pmem=1gb #PBS -l walltime=07:00:00:00 #PBS -l nodes=2:ppn=8 #PBS -e /work/chu/wam_cyp/error_run #PBS -o /work/chu/wam_cyp/out_run #source /etc/profile module load compile/gccmpi/mpich2 set year = 2010 set month = 07 set day = 01 setfixedyear = 2010 setfixedmonth = 07 setfixedday = 01 setnumber_of_days = 92 setstart_date = echo 'current date = ' $year$month$day echo 'start_date = ' $start_date ##################################### cd /work/chu/wam_cyp/ echo 'removing old files' rm -rf /work/chu/wam_cyp/*www rm -rf /work/chu/wam_cyp/* rm -rf /work/chu/wam_cyp/*swe rm -rf /work/chu/wam_cyp/*swe.bz2 rm -rf /work/chu/wam_cyp/out_model_* #rm -rf /work/chu/wam_cyp/winds/wind1-*h rm -f graphics_in rm -rf./wam/wamrun/tmp/ ## Cp-ing Wind files ########################################################################### #echo 'cping wind files' #cp /work/chu/winds/$year/$month/wind1-*h* /work/chu/wam_cyp/winds/ #cd /work/chu/wam_cyp/winds/ #bunzip2./wind1-*h* ################################################ cd /work/chu/wam_cyp/ ####### making include file for post process ######################### echo ' &INPUT' >graphics_in echo ' ' >>graphics_in echo ' aslat = 30.0' >>graphics_in echo ' anlat = 38.0' >>graphics_in
136 echo ' echo ' echo ' echo ' echo ' echo ' echo ' echo ' echo ' echo ' echo ' echo ' awlon = 27.5' >>graphics_in aelon = 36.5' >>graphics_in res = ' >>graphics_in ' >>graphics_in IYEAR = '$year >>graphics_in IMON = '$month >>graphics_in IDAY = '$day >>graphics_in ' >>graphics_in ihb = 0' >>graphics_in ihs = 2208' >>graphics_in ihstep = 6' >>graphics_in &END' >>graphics_in cp./graphics_in./pgrid/ ################################################# ############################# WAM ################################# echo 'running WAM' cd /work/chu/wam_cyp/./run_wamodel>./out_model_$month$year
137 #!/bin/csh #PBS -N pb_script ##PBS -o Job_Output.txt #PBS -l pmem=1gb #PBS -l walltime=00:06:00:00 #PBS -l nodes=1:ppn=1 #PBS -e /work/chu/wam_cyp/error_pb #PBS -o /work/chu/wam_cyp/out_pb set year = 2010 set month = 04 set day = 01 setfixedyear = 2010 setfixedmonth = 04 setfixedday = 01 setnumber_of_days = 91 setstart_date = APPENDIX B The script that supervises all the post processes echo 'current date = ' $year$month$day echo 'start_date = ' $start_date ######################################################### cd /work/chu/wam_cyp/ cp /work/chu/wam_cyp/graphics_in /work/chu/wam_cyp/pgrid/ cd /work/chu/wam_cyp/wam/wamrun/ rm -rf MAP* SWE* RFL* AMP* ASS* OUT* AUT* ##################################################### ###################### PGRID ########################### echo 'running post process for main results' rm -f /work/chu/wam_cyp/graphics/images/*png cd /work/chu/wam_cyp/pgrid/ rm -f /work/chu/wam_cyp/pgrid/*www rm -f /work/chu/wam_cyp/pgrid/wave1-* cp /work/chu/wam_cyp/w*00.www /work/chu/wam_cyp/w*06.www /work/chu/wam_cyp/w*12.www /work/chu/wam_cyp/w*18.www /work/chu/wam_cyp/pgrid/ sleep 1 /work/chu/wam_cyp/pgrid/graphics</work/chu/wam_cyp/pgrid/graphics_in>/work/chu/wam_c yp/pgrid/graphics.out sleep 1 /work/chu/wam_cyp/pgrid/wam.graphics.cyp>/work/chu/wam_cyp/pgrid/out.graphics.cyp sleep 1 cd /work/chu/wam_cyp/pgrid/ rm -f /work/chu/wam_cyp/pgrid/*www rm -f /work/chu/wam_cyp/pgrid/wave1-*utc rm -f /work/chu/wam_cyp/pgrid/wavemax rm -f /work/chu/wam_cyp/pgrid/latlon rm -f /work/chu/wam_cyp/pgrid/graphics.out rm -f /work/chu/wam_cyp/pgrid/gmeta rm -f /work/chu/wam_cyp/pgrid/1.xwd rm -f /work/chu/wam_cyp/pgrid/out
138 mkdir /work/chu/wam_cyp/graphics/images/$month$year cd /work/chu/wam_cyp/graphics/images/ /bin/mv -f /work/chu/wam_cyp/graphics/images/*.png /work/chu/wam_cyp/graphics/images/$month$year/ ######################################################### ################### Storing Data ##################################### echo 'bzip results' cd /work/chu/wam_cyp/ bzip2 /work/chu/wam_cyp/*www bzip2 /work/chu/wam_cyp/*swe bzip2 /work/chu/wam_cyp/*out_model_$month$year mkdir /work/chu/results/$year/$month/ echo 'BackUp Results' cd /work/chu/wam_cyp/ cp -f /work/chu/wam_cyp/* /work/chu/results/$year/$month/ cp -f /work/chu/wam_cyp/*swe.bz2 /work/chu/results/$year/$month/
139 References. Abdalla S., Bidlot, J., Janssen P., 2005: Assimilation of ERS and ENVISAT wave data at ECMWF, ENVISAT & ERS Symposium, Salzburg, Austria, 6-10 Sep (ESA SP-572, Apr. 2005). Bidlot, J. and Janssen, P. 2003: Unresolved bathymetry, neutral winds and new stress tables in WAM. ECMWF Research Department Memo R60.9/JB/0400. Janssen P.A.E.M., P. Lionello, M. Reistad, Hollingsworth A., 1987: A study of the feasibility of using sea and wind information from the ERS-1 satellite, part 2: Use of scatterometer and altimeter data in wave modelling and assimilation. ECMWF report to ESA, Reading. Jansen, P.A.E.M., 2000: ECMWF wave modeling and satellite altimeter wave data. In D. Halpern (Ed.), Satellites, Oceanography and Society, pp , Elsevier. Kallos, G., 1997: The Regional weather forecasting system SKIRON. Proceedings, Symposium on Regional Weather Prediction on Parallel Computer Environments, October 1997, Athens, Greece, 9 pp. Komen G., Cavaleri L., Donelan M., Hasselmann K., Hasselmann S., Janssen P.A.E.M., 1994: Dynamics and Modelling of ocean waves, Cambridge University Press. Lionello, P., Günther H., Janssen P.A.E.M., 1992: Assimilation of altimeter data in a global third generation wave model, Journal of Geophysical Research, 97 (C9), Lionello, P., Günther H., Hansen B., 1995: A sequential assimilation scheme applied to global wave analysis and prediction, Journal of Marine Systems, 6, Papadopoulos, A., P. Katsafados, and G. Kallos, 2001: Regional weather forecasting for marine application. Global Atmos. Ocean Syst., 8, No 2-3, Mori N. and P.A.E.M. Janssen, 2006: On kurtosis and occurrence probability of freak waves. J. Phys. Oceanogr. 36, Tonani M., N.Pinardi, M.Adani, A. Bonazzi, G.Coppini, M.DeDominicis, S.Dobricic, M.Drudi, N.Fabbroni, C.Fratianni, A.Grandi, S.Lyubartsev, P.Oddo, D.Pettenuzzo, J.Pistoia and I.Pujol, The Mediterranean ocean Forecasting system, Coastal to Global Operational Oceanography: Achievements and Challenges. Proceedings of the Fifth International Conference on EuroGOOS May 2008, Exeter, UK WAMDIG, The WAM-Development and Implementation Group: Hasselmann S., Hasselmann K., Bauer E., Bertotti L., Cardone C.V., Ewing J. A., Greenwood J.A., Guillaume A., Janssen P. A. E. M., Komen G. J., Lionello P., Reistad M., Zambresky L., 1988: The WAM Model - a third generation ocean wave prediction model, Journal of Physical Oceanography, 18(12), WISE Group, 2007: Wave modelling The state of the art, Progress in Oceanography 75,
140 APPENDIX 22 (Deliverable No. 11) Operational script supervising the run of the KZ and Kalman filters #!/bin/csh ################ Parameters ############################################## set a=8 ## forecast horizon set b=36 ## cut of days (in hours) b>m*p+a ########################################################################### ## cp yv1.txt yv.txt cp x_matrix1.txt x_matrix.txt cp P_matrix1.txt P_matrix.txt cp x1.txt x.txt cp Kalman1.txt Kalman_results.txt rm -rf out rm -rf./results set number_of_hours=712 ### (file lines - loop_hours) set loop_hours=$a set k=$b while ( $k < $number_of_hours m1 = $k + m2 = $m1 + $loop_hours echo $k, $m1, $m2 ########### Running KZ_filter on all the availables time series cd /s40/ggalanis/kz_filters/ echo ' Parameter (n = ' $m1 ')! Number of input data' > KZ.h echo ' Parameter (m = 5)! Mooving Average Window' >> KZ.h echo ' Parameter (p = 5)! Iterations number' >> KZ.h /usr/bin/f90 -o./kz./kz.f head -$m1./obs_data >./input_data./kz > out_kz sleep 1 mv results obs.kz head -$m1./model_data >./input_data./kz > out_kz sleep 1 mv results model.kz ################################### tail -$a obs.kz > obs.txt tail -$a model.kz > model1.txt head -$m2./model_data tail -$a > model2.txt cd /s40/ggalanis/kz_filters/./kalman_kz >./out sleep 1 more./kalman.txt >>./Kalman_results.txt sleep k = $k + $loop_hours end
141 The code of the Kolmogorov Zurbenko filter implicit none integer n,i,j,k,p,date,t,t1,t2 real m, X Parameter (n = 769)! Number of input data Parameter (m = 33)! Mooving Average Window Parameter (p = 13)! Iterations number dimension date(n), X(0:p,n) open (unit=10, file='./input_data',status='old') open (unit=20, file='./results',status='new') do t=1,n read (10,*) date(t), X(0,t) write (*,*) date(t), X(0,t) enddo k = nint((m-1)/2.0) write (*,*) 'k= ', k do i=1,p write (*,*) 'iteration number = ', i t1 = (i*k)+1 t2 = n-(i*k) write (*,*) 't1= ', t1, 't2= ', t2 do t=t1,t2 X(i,t) = 0 do j=-k,k,1 X(i,t) = X(i,t) + X(i-1,t+j) enddo X(i,t) = (1.0/m)*X(i,t) enddo enddo do t=t1,t2 write (20,*) X(p,t) enddo close (10) close (20) stop end
142 The code of the Kalman filter Program Kalman implicit none integer dim,i,j,k,m,n,status,date_mod1,date_mod2,date_obs,hours, & hour_obs, history_index, index real E,L1,L2,a1,S1,S2,S3,b1,Covar,Var,diff,yV,xV, +temp,a,b,c,tobs,tmod1,tmod2,uobs,umod, +D,W,V,H,P,PR,S,T,x,y,z,ss,x_matrix, +Q1,P1,KG,ID,pre,Mean,Obs,Model,KAL,ErrorModel,ErrorKAL,Sum,Q, +Sumsquare,MeanError,MeanAbsError,StDevError,StDevAbsError,RMSE, +Probab,Sumabs,aa, history_index_r, index_r Parameter (dim=3) Parameter (hours=8) Parameter (history_index=7) Parameter (index=history_index-1) dimension L1(0:index),L2(0:index),E(dim,0:index),a1(0:index), +b1(0:index),diff(dim,dim),yv(0:index),xv(dim,0:index), +temp(dim,dim),a(dim,dim), +C(dim,dim),H(dim,dim),PR(dim,dim),x_matrix(dim,0:history_index), +KG(dim,dim),S(dim,dim),T(dim,dim),x(dim,dim),Q(dim,dim), +P1(dim,dim),ID(dim,dim),B(dim,dim),Obs(9000), +Model(9000),KAL(9000),ErrorModel(9000),ErrorKAL(9000), +W(dim,dim), P(dim,dim), +Tobs(hours), Tmod1(hours), Tmod2(hours), +date_mod1(hours), date_mod2(hours), date_obs(hours) character*100 none do m=1,dim do n=1,dim if (m.eq.n) then ID(m,n)=1 else ID(m,n)=0 endif enddo enddo history_index_r = history_index*1.0 index_r = index*1.0 open (unit=10, file='./obs.txt',status='old')! obs open (unit=15, file='./model1.txt',status='old')! model's yest fcst open (unit=18, file='./model2.txt',status='old')! model's new fcst do i=1,hours read (10,*) Tobs(i)
143 enddo 1000 format(i12,1x,f5.2) do i=1,hours read (18,*) date_mod2(i), Tmod2(i) enddo do i=1,hours read (15,*) Tmod1(i) enddo 1500 format(i2,1x,i2,1x,i2,4x,i2,10x,f5.2) DO i=1,hours! Loop over number of hours write (*,*) 'HOUR=', i pre=tmod1(i) open (unit=20, file='kalman.txt', status='old') ss = Tmod1(i) z = Tobs(i) 110 y=z-ss do n=1,dim H(1,n)=ss**(n-1) enddo open (unit=16, file='yv.txt', status='old') do j=0,index read(16,*) yv(j) enddo open (unit=17, file='x_matrix.txt', status='old') do j=0,history_index read(17,*) (x_matrix(m,j), m=1,dim) enddo do j=1,history_index do m=1,3 xv(m,j) = x_matrix(m,j) - x_matrix(m,j-1) enddo enddo call Variance(yV,S1,S2,Mean,V,dim,history_index,index) open (unit=19, file='p_matrix.txt', status='old') do n=1,dim read(19,*) (P(m,n), m=1,dim) enddo
144 open (unit=21, file='x.txt', status='old') read(21,*) (x(m,1), m=1,dim) do m=1,dim do n=1,dim call Line(xV,dim,m,L1,index) call Line(xV,dim,n,L2,index) call Covariance(L1,L2,S1,S2,S3,W(m,n),dim,history_index,index) enddo enddo Ccccccccc KALMAN GAIN cccccccccccccccccccccccccccccccccccccccccccccc 120 do m=1,dim do n=1,dim P1(m,n) = P(m,n) + W(m,n) enddo enddo call sf(h,p1,q,dim) Q1=Q(1,1) call mt(h,t,dim) call mprod(p1,t,pr,dim) do m=1,dim do n=1,dim KG(m,n)=PR(m,n)/(Q1+V) enddo enddo Cccccccccc CALCULATION OF THE NEW VALUE ccccccccccccccccccccccc call mprod(h,x,pr,dim) D=y-PR(1,1) call mprod(kg,d,pr,dim) do m=1,dim do n=1,dim S(m,n)=x(m,n)+PR(m,n) temp(m,n)=x(m,n) x(m,n)=s(m,n) diff(m,n)=x(m,n)-temp(m,n) enddo enddo ss = Tmod2(i) if (dim.eq.1) then pre=x(1,1)+ss else pre=x(1,1)+(x(2,1)+1)*ss
145 endif if (dim.ge.3) then do m=3,dim pre=pre+x(m,1)*(ss**(m-1)) enddo endif if ((abs(pre-tmod2(i)).gt.10.).or.(pre.lt.0.)) then pre = Tmod2(i) endif write (20,3000) date_mod2(i), Tmod2(i), pre 3000 FORMAT(I10,2x,f8.2,2x,f8.2) Ccccccccccccccc UPDATE OF COEFFICIENTS ccccccccccccccccccccccccc call mprod(kg,h,pr,dim) call mdif(id,pr,d,dim) call mprod(d,p1,pr,dim) do m=1,dim do n=1,dim P(m,n)=PR(m,n) enddo enddo Cccccccccccccccccccccccccccccccccccccccccccccccccccccccccccccccccccc 150 close (10) close (15) close (16) close (17) close (18) close (19) close (21) call system ("rm -f./yv.txt") call system ("rm -f./x_matrix.txt") call system ("rm -f./p_matrix.txt") call system ("rm -f./x.txt") CCC update of yv file CCCCCCCCCCCCCCCCCCCCCCCCCCCCCCCCCCCCCCCCCCCCCCCC open (unit=16, file='yv.txt', status='new') do j=1,index write (16,*) yv(j) enddo yv(index) = Tobs(i)-Tmod1(i) do m=1,dim aa = Tmod1(i)
146 yv(index) = yv(index)-x(m,1)*(aa**(m-1)) enddo write (16,*) yv(index) close (16) Ccccccccccc update of x_matrix file ccccccccccccccccccccccccccccccccccc open (unit=17, file='x_matrix.txt', status='new') do j=1,history_index write (17,*) (x_matrix(m,j), m=1,dim) enddo write (17,*) (x(m,1), m=1,dim) close (17) Ccccccccccc update of P_matrix file ccccccccccccccccccccccccccccccccccc open (unit=19, file='p_matrix.txt', status='new') do n=1,dim write(19,*) (P(m,n), m=1,dim) enddo close (19) Ccccccccccc update of x file ccccccccccccccccccccccccccccccccccc open (unit=21, file='x.txt', status='new') write (21,*) (x(m,1), m=1,dim) close (21) CCCCCCCCCCCCCCCCCCCCCCCCCCCCCCCCCCCCCCCCCCCCCCCCCCCCCCCCCCCCCCCCCCCCCC CCCCC 100 continue END DO! end do loop over days stop end Ccccccccccccc TRANSPOSED MATRIX cccccccccccccccccccccccccccccccccccccc Cccccccccc T = the transpose of A cccccccccccccccccccccccccccccccccc subroutine mt(a,t,dim) integer dim real A, T dimension A(dim,dim), T(dim,dim) do m=1,dim do n=1,dim T(m,n)=A(n,m) enddo enddo return end Cccccccccccccccccccccccccccccccccccccccccccccccccccccccccccccccccccccccc Cccccccccccccc PRODUCT OF MATRICES ccccccccccccccccccccccccccccccccccccc
147 Ccccccccccccc PR = A * B ccccccccccccccccccccccccccccccccccccc subroutine mprod(a,b,pr,dim) integer dim real A,B,PR DIMENSION A(dim,dim), B(dim,dim), PR(dim,dim) do m=1,dim do n=1,dim PR(m,n)=0 enddo enddo do m=1,dim do n=1,dim do k=1,dim PR(m,n)=PR(m,n)+A(m,k)*B(k,n) enddo enddo enddo return end Ccccccccccc TRIPLE PRODUCT ccccccccccccccccccccccccccccccccccccccccccccc Cccccccc Q = A * B * TR(A) cccccccccccccccccccccccccccccccc subroutine sf(a,b,q,dim) integer dim real A, B, C, Q, PR, T dimension A(dim,dim),B(dim,dim),C(dim,dim),Q(dim,dim),PR(dim,dim), +T(dim,dim) call mprod(a,b,pr,dim) do m=1,dim do n=1,dim C(m,n)=PR(m,n) enddo enddo call mt(a,t,dim) call mprod(c,t,pr,dim) do m=1,dim do n=1,dim Q(m,n)=PR(m,n) enddo enddo return
148 end Ccccccccccccccccc DIFFERENCE OF MATRICES cccccccccccccccccccccccccccccccccccccc subroutine mdif(a,b,d,dim) integer dim real A, B, D dimension A(dim,dim), B(dim,dim), D(dim,dim) do m=1,dim do n=1,dim D(m,n)=A(m,n)-B(m,n) enddo enddo return end Ccccccccccccccc VARIANCE ccccccccccccccccccccccccccccccccccccccccccccc subroutine Variance(a1,S1,S2,Mean,Var,dim,history_index,index) integer dim,history_index,index real a1,s1,s2,mean,var,history_index_r,index_r dimension a1(0:index) integer i S1=0 S2=0 Mean=0 Var=0 history_index_r = history_index*1.0 index_r = index*1.0 do i=0,index S1=S1+a1(i) S2=S2+(a1(i)**2) enddo Mean=S1/history_index_r Var=(1.0/index_r)*S2-(history_index_r/index_r)*(Mean**2) return end Ccccccccccccccc COVARIANCE ccccccccccccccccccccccccccccccccccccccccccccc subroutine Covariance(a1,b1,S1,S2,S3,Covar,dim,history_index, +index) integer dim,history_index,index real a1,b1,s1,s2,s3,covar,history_index_r,index_r dimension a1(0:index), b1(0:index) integer i
149 S1=0 S2=0 S3=0 Covar=0 history_index_r = history_index*1.0 index_r = index*1.0 do i=0,index S1=S1+a1(i) S2=S2+b1(i) S3=S3+a1(i)*b1(i) enddo Covar=(1.0/history_index_r)*S3 - + (S1/history_index_r)*(S2/history_index_r) return end Ccccc i-line of the matrix E cccccccccccc subroutine Line(E,dim,i,L1,index) integer i,n,dim,index real E,L1 dimension E(dim,0:index), L1(0:index) do n=0,index L1(n)=E(i,n) enddo return end
150 APPENDIX 23 E-Wave: Integrated High Resolution System for Monitoring and Quantifying the Wave Energy Potential in the EEZ of Cyprus Mathematical Statistical models for the local adaptation of the wave platform results and the estimation of power potential Technical Report September 2011
151 One of the main problems of numerical systems that simulate the evolution of environmental parameters in time and space is the systematic biases that emerge when one focuses on restricted areas trying to obtain local information. As a result, although numerical weather and wave models simulate successfully the general sea wave physical processes, usually fail to provide accurate local information which, however, is of great importance for various applications as the estimation of wave energy potential. Concerning the wave models, this drawback is mainly due to the fact that the model outputs are strongly depended on local characteristics, initial conditions as well as on the corresponding atmospheric data used as forcing. On the other hand, numerical systems cannot simulate successfully sub-grid scale phenomena. This is especially true in areas with complicated coastal formations where overshadowing and inaccurate refraction wave features are usual problems. Since local wave forecasts are essential for the objectives of the E-wave project, statistical techniques have been utilized, by the scientists participating in the consortium, targeting at the optimal local adaptation of the direct outputs of the wave system in use and the elimination of any possible systematic biases. The methodology adopted is based on the use of local (in situ) observations that are recursively combined with model outputs based on Kalman and Kolmogorov-Zurbenko filters. Moreover, a statistical analysis tool aiming at the estimation of the spatial distribution of wave energy potential has been developed and is presented in this report. It is able to provide a number of statistical indexes as well as the optimum probability density function for the data in study. 1

152 I. A new mathematical model for the optimization and local adaptation of the results of numerical wave predictions. A statistical technique pursuing the optimal local adaptation of the direct outputs of the wave model WAM is proposed. In principle, the target is to reduce possible systematic biases by using available measurements in the area of interest. The methodology is based on a combination of two different statistical tools: Kolmogorov-Zurbenko (KZ) and Kalman filters. KZ filters reduce the variability that the observation time series normally appear in order to be compatible with the model direct outputs. This is not the case in general, since the simulated values are smoothed spatially and temporarily by the model itself while observations are point records where no smoothing procedure is applied. The direct application of a bias subtraction filter to such qualitatively different series may lead to serious instabilities of the method and discontinuities in the results. The outputs of KZ-procedure are compatible time series that can be utilized, in a second step, by Kalman filters for the identification and subtraction of systematic errors. The proposed filters were tested in an open sea area where corresponding observations were continuously available for a sufficient time period. This is something essential for the effectiveness of the method since possible discontinuities may lead to serious discrepancies. For this reason, as testing area was selected the southwest cost of United States, that includes the area where the US Naval Postgraduate School (US-NPS, partner of the E-wave project) is located (see fig. 1). An additional reason for choosing the specific area was the systematic deviations appeared between model simulations and local observations, a problem that the study performed aimed to address. The locations of the buoys used as observational sources are also indicated in fig. 1. All of them belong to NOAA/National Data Buoy Center network, where provided by US-NPS and their exact positions in Lat-Lon coordinates are declared in Table 1 Buoy Lat Lon A N W B N W C N W D N W E N W F N 32.5 W 118 Figure 1. The area of interest and the locations of buoys used (A-F) Table 1. Coordinates of the buoys 2
153 I.a. Kolmogorov-Zurbenko filters Kolmogorov-Zurbenko (KZ) filters are based on iterative moving averages: 1 x x, k 1,2,..., n (1) q k k 1 i i j 2q 1 j q aiming at the removement of high frequency variations from the initial data (see Eskridge et. al., 1997 and Rao et. al., 1997). In the previous formula, parameter q stands for the length of the filter window (m=2q+1) which controls, jointly with the number of iterations n, the portion of the variability that one wants to exclude. In particular, the desired separating frequency is A typical example where the need of KZ filter application is necessary is presented in figure 2. Figure 2. Direct model outputs and observations from buoy (E). The time series of significant wave height values as simulated by WAM and the corresponding buoy records are plotted. It becomes obvious that, although the model follows the general pattern of the observations, the two time series have totally different qualitative characteristics. These discrepancies are significantly eased by passing the two time series through the same KZ filter (m=5, n=5, which is equivalent to a cutoff frequency of or 24.3 time steps). The high frequencies are subtracted, the filtered time series become compatible while the existing systematic divergence between forecasts and observations becomes more evident (see fig. 3). 3
154 Figure 3. WAM forecasts and observations from buoy (E) after passing a (5,5)-KZ filter. The above mentioned systematic bias is eliminated in a following second stage by utilizing Kalman filters. I.b. Kalman filters Kalman filters simulate the evolution in time of an unknown process (state vector), whose true value at time t i is denoted here by t x ( t i ). This is combined with a corresponding known array (observations) equation: O y i which refers to the same time. The change of x in time is governed by the system t t x ( ti ) Mi 1[x ( ti 1)] ( ti 1) (2) The observation equation describes the relation between the observation vector and the unknown one: The matrices M i (system operator), O t yi Hi[x ( ti )] i. (3) H i (observation operator) as well as the covariance matrices Q(t i ), R(t i ) of the Gaussian (by assumption) and independent random vectors ( t i ), i, respectively, have to be determined before the application of the filter. The first forecast step of the state vector x and its error covariance matrix P is given by: f a x ( ti ) Mi 1[x ( ti 1)], f a P ( t ) 1P ( 1) T i Mi ti Mi 1 Q( ti 1) (4a). (4b) This is followed up by an update (analysis) step in which the observation available at time t i is combined with the previous information: a f f x ( t ) x ( ) ( O i ti Ki yi Hi[x ( ti )]), (5a) a f P ( ti ) ( I KiHi )P ( ti ) (5b) 4
155 Here K P ( t ) H [ H P ( t ) H R ] (6) f T f T 1 i i i i i i i is the Kalman gain that arranges how easily the filter adjusts to possible new conditions. The superscripts o, t, f, a denote observations, true, forecast and analysis value correspondingly. Moreover, T and -1 stand for the transpose and the inverse matrices, respectively, while I is the unitary matrix. Equations (2)-(6) update the Kalman algorithm from time t i-1 to t i. For the purposes of the E-wave project, a single forecasted parameter in time was utilized: the significant wave height (swh). The corresponding bias is estimated as a polynomial of the forecasting model direct output: y a a swh (7) O i 0,i 1,i i i where swh i denotes the direct output of the model at time t i and O y i is the corresponding bias. The coefficients a0, i, a 1, i are the parameters that have to be estimated by the filter while ε i is the Gaussian, non systematic, error of the procedure. In this way, the state vector of the filter becomes x ( ti ) a0, i a1, i bias y, the observation matrix takes the form swh O i Hi 1 i is used. Therefore, the system and observation equations become T, the observation is the (scalar) and as system matrix the identity I 2 t t O t x ( ti 1) x ( ti ) ( ti ), yi Hi[x ( ti )] i (8) The above described Kalman filter was applied to the six available buoys A-E. The filters performed well in all cases eliminating the major part of the systematic error, despite its type. In Table 2 some statistical results concerning the bias and the root mean square error (RMSE) for the area of interest before and after the filters application are presented. Buoy A Buoy B Buoy C Model + Model + Model + Model Filters Model Filters Model Filters Bias RMSE Buoy D Buoy E Buoy F Average Model + Model + Model + Model + Model Filters Model Filters Model Filters Model Filters Bias RMSE
 are presented.")
156 Table 2. Statistics for all buoy locations before and after the use of the filters. In all cases, the bias is almost vanished while RMSE is decreased. In figures 4 and 5 the time series of two different cases (buoys C and D) are presented. The improvement of the initial model results by the elimination of the systematic error is obvious in both cases. Figure 4. WAM direct outputs, KZ+Kalman improved forecasts and the corresponding observations from buoy C. Figure 5. WAM direct outputs, KZ+Kalman improved forecasts and the corresponding observations from buoy D. The scripts and programs for the use of the above filters are presented in Appendixes A C. 6
157 II. A statistical system for the estimation of local energy potential based on sea wave characteristics. A statistical system has been developed within the framework of the E-wave project that allows the estimation of energy potential at each area of interest based on the local wave climate characteristics. The system utilizes the significant wave height and mean wave period values as simulated by the wave model WAM. These values are statistically analyzed by means of the main descriptive statistical measures that describe their mean values, variability and symmetry while probability distribution functions that optimally fit to the data in study are derived. More precisely, the following statistical indices have been employed: Mean value: 1 N N i 1 xi (), where x denotes the parameter in study (significant wave height, mean wave period or wave energy) and N the size of the sample. N 1 xi () N Standard Deviation: 2 i 1, a typical variation index. Skewness : g 1 N N i xi () 3 a measure of the asymmetry of the probability distribution. Kurtosis: g 1 N N i xi () 4 3 measuring the "peakedness" of the probability distribution. On the other hand, the wave energy potential (flux of wave energy per unit crest length) at the area of interest has been estimated based on the following formula: 2 g 2 P HsT 64 (see Pontes M.T., 1998) where, H s denotes the significant wave height, T e the wave period, ρ the water density and g the gravity acceleration. The significant wave height is given in meters (m), the wave period in seconds (s) and the energy potential in kilowatts per meter (kw/m). Some characteristics results covering a period of one year (October 2008 September 2009) are presented in figures 6-9. The first two cover the months October March ( cold period). e 7


158 Mean Significant Wave Height (m) Mean Wave Period (sec) Mean Wave Energy (kw/m) Figure 6. Mean values of Significant Wave Height, Wave Period and Wave Energy for the period October 2008 March St. Deviation of Sign. Wave Height (m) St. Deviation of Wave Period (sec) St. Deviation of Wave Energy (kw/m) Figure 7. Standard Deviation of Significant Wave Height, Wave Period and Wave Energy for the period October 2008 March These first results reveal increased values of wave energy at the west coastline of Cyprus due to the prevailing swell waves in the area and the elevated values of H s. On the other hand, the asymmetry of the three parameters as described by their skeweness is kept in acceptable limits as illustrated in the next figure. Skeweness of Sign. Wave Height Skeweness of Wave Period Skeweness of Wave Energy Figure 8. Skeweness of Significant Wave Height, Wave Period and Wave Energy for the period October 2008 March In figures 9-11, the same wave characteristics are presented focusing on the warm months of the year (April September). The obtained results confirm the advantages of the west Cyprus coastline concerning possible wave energy exploitation. 8
 Figure 9.")

 St.")


159 Mean Significant Wave Height (m) Mean Wave Period (sec) Mean Wave Energy (kw/m) Figure 9. Mean values of Significant Wave Height, Wave Period and Wave Energy for the period April September St. Deviation of Sign. Wave Height (m) St. Deviation of Wave Period (sec) St. Deviation of Wave Energy (kw/m) Figure 10. Standard Deviation of Significant Wave Height, Wave Period and Wave Energy for the period April September Skeweness of Sign. Wave Height Skeweness of Wave Period Skeweness of Wave Energy Figure 11. Skeweness of Significant Wave Height, Wave Period and Wave Energy for the period April September On the other hand, the estimated power data were fitted to a number of probability density functions in order to define the statistical distribution that describes them in the optimum way. More precisely, the following pdfs where employed: Logistic, Normal, Gamma, Log-Gamma, Log-Logistic, Lognormal, Weibull, Generalized Logistic while different statistical fitted tests were used: Kolmogorov-Smirnov, Anderson-Darling (D'Agostino et. al., 1986). 9
160 The obtained results prove a clear prevalence of the lognormal distribution for the cold period and of the Generalized Extreme Values (GEV) distribution for the warm period. The corresponding probability density functions are: Lognormal distribution ( ) where the parameters μ and σ are defined by the mean value m and the variance v:, ( ) ( ) Generalized Extreme Value distribution ( ) ( ), where the μ is the location parameter, σ the scale and k the shape parameter. It is important to underline that the parameters of the optimal distribution for each case vary in space providing important information for the wave energy potential. In Figures this spatial variation is illustrated. Lognormal μ-parameter Lognormal σ-parameter Figure 12. The spatial distribution of the Lognormal pdf parameters during the period October 2008 March
161 Figure 13. The spatial distribution of the GEV pdf parameters during the period April September Based on the above results, the end user is able to consider the appropriate version of probability density function that fits to the wave data parameters and to energy potential at the point or area of interest obtaining, in this way, accurate information on the wave energy mean value, variance, and the corresponding extreme values. The scripts and programs for the operational use of the above power estimation tool are presented in Appendix D. References. D'Agostino R. B., Stephens M.A., 1986: Goodness-of-fit Techniques, New York: Marcel Dekker. Eskridge R.E., Ku J. Y., Rao S.T., Porter P. S., and Zurbenko I. G., Separating Different Scales of Motion in Time Series of Meteorological Variables, Bul. Amer. Met. Soc., 78 (1997), 7, Galanis G. and Anadranistakis M., A one dimensional Kalman filter for the correction of near surface temperature forecasts, Meteor. Appl. 9 (2002), Galanis G., Louka P., Katsafados P., Kallos G., and Pytharoulis I., Applications of Kalman filters based on non-linear functions to numerical weather predictions, Annales Geophysicae, 24 (2006), Kalman R. E., A new approach to linear filtering and prediction problems, Trans. ASME, Ser. D, 82 (1960), Kalman R.E. and Bucy R.S., New results in linear filtering and prediction problems, Trans. ASME, Ser. D, 83 (1961), Kalnay E., Atmospheric Modeling, Data Assimilation and Predictability. Cambridge University Press, 341, Kallos, G., 1997: The Regional weather forecasting system SKIRON. Proceedings, Symposium on Regional Weather Prediction on Parallel Computer Environments, October 1997, Athens, Greece, 9 pp. Komen G., Cavaleri L., Donelan M., Hasselmann K., Hasselmann S., Janssen P.A.E.M., 1994: Dynamics and Modelling of ocean waves, Cambridge University Press. Lionello, P., Günther H., Janssen P.A.E.M., 1992: Assimilation of altimeter data in a global third generation wave model, Journal of Geophysical Research, 97 (C9),
162 Lionello, P., Günther H., Hansen B., 1995: A sequential assimilation scheme applied to global wave analysis and prediction, Journal of Marine Systems, 6, Papadopoulos, A., P. Katsafados, and G. Kallos, 2001: Regional weather forecasting for marine application. Global Atmos. Ocean Syst., 8, No 2-3, Pontes M.T., 1998: Assessing the European Wave Energy Resource, Transaction of ASME Vol. 120, pp Persson A., Kalman filtering a new approach to adaptive statistical interpretation of numerical meteorological forecasts, ECMWF Newsletter, Rao S.T., Zurbenko I.G., Neagu R., Porter P.S., Ku J.Y. and Henry R.F., Space and Time Scales in Ambient Ozone Data, Bull. Amer. Meteor. Soc. 78, No. 10 (1997), Tonani M., N.Pinardi, M.Adani, A. Bonazzi, G.Coppini, M.DeDominicis, S.Dobricic, M.Drudi, N.Fabbroni, C.Fratianni, A.Grandi, S.Lyubartsev, P.Oddo, D.Pettenuzzo, J.Pistoia and I.Pujol, The Mediterranean ocean Forecasting system, Coastal to Global Operational Oceanography: Achievements and Challenges. Proceedings of the Fifth International Conference on EuroGOOS May 2008, Exeter, UK WAMDIG, The WAM-Development and Implementation Group: Hasselmann S., Hasselmann K., Bauer E., Bertotti L., Cardone C.V., Ewing J. A., Greenwood J.A., Guillaume A., Janssen P. A. E. M., Komen G. J., Lionello P., Reistad M., Zambresky L., 1988: The WAM Model - a third generation ocean wave prediction model, Journal of Physical Oceanography, 18(12), WISE Group, 2007: Wave modelling The state of the art, Progress in Oceanography 75,
163 APPENDIX 24 (Deliverable No. 12) The scripts and the code supervising the Power estimation system #!/bin/csh cd /mnt/data/ggalanis/postprocess/domain/ set filename = `awk '{print $1}'./filename.txt` set Lon = `awk '{print $2}'./filename.txt` set Lat = `awk '{print $3}'./filename.txt` echo $Lon, $Lat, $filename ll./data2/warm/$filename cp -f./data2/warm/$filename./www3.txt set nlines = `wc -l./www3.txt awk '{print $1}' ` if ($nlines > 6) then /home/ggalanis/matlab/bin/matlab <./matlab_stats.m > matlab.out1 grep -A 68 "mu ="./matlab.out1 >./matlab.out set mu = `head -3./matlab.out tail -1` set sigma = `head -8./matlab.out tail -1` set m_swh = `head -13./matlab.out tail -1` set sd_swh = `head -18./matlab.out tail -1` set sk_swh = `head -23./matlab.out tail -1` set ku_swh = `head -28./matlab.out tail -1` set m_per = `head -33./matlab.out tail -1` set sd_per = `head -38./matlab.out tail -1` set sk_per = `head -43./matlab.out tail -1` set ku_per = `head -48./matlab.out tail -1` set m_we = `head -53./matlab.out tail -1` set sd_we = `head -58./matlab.out tail -1` set sk_we = `head -63./matlab.out tail -1` set ku_we = `head -68./matlab.out tail -1` else set mu = set sigma = set m_swh = set sd_swh = set sk_swh = set ku_swh = set m_per = set sd_per = set sk_per = set ku_per = set m_we = set sd_we =
164 set sk_we = set ku_we = endif echo $Lon $Lat $mu $sigma $m_swh $sd_swh $sk_swh $ku_swh $m_per $sd_per $sk_per $ku_per $m_we $sd_we $sk_we $ku_we >>./stats_final./matlab_stats.m: [swh mper we]=textread('./www3.txt', '%f %f %f'); parmhat = lognfit(we); mu=parmhat(1); sigma=parmhat(2); m_swh=mean(swh); m_per=mean(mper); m_we=mean(we); sd_swh=std(swh); sd_per=std(mper); sd_we=std(we); sk_swh=skewness(swh); sk_per=skewness(mper); sk_we=skewness(we); k_swh=kurtosis(swh)-3; k_per=kurtosis(mper)-3; k_we=kurtosis(we)-3; mu sigma m_swh sd_swh sk_swh k_swh m_per sd_per sk_per k_per m_we sd_we sk_we k_we 1
165 Program Graphics integer status,k,l,nx,ny,itest real lat,lon,mu,sigma,m_swh,sd_swh,sk_swh,ku_swh,m_per,sd_per, & sk_per,ku_per,m_we,sd_we,sk_we,ku_we real mu_1,sigma_1,m_swh_1,sd_swh_1,sk_swh_1,ku_swh_1,m_per_1, &sd_per_1,sk_per_1,ku_per_1,m_we_1,sd_we_1,sk_we_1,ku_we_1 dimension mu_1(2000,2000),sigma_1(2000,2000),m_swh_1(2000,2000) dimension sd_swh_1(2000,2000), sk_swh_1(2000,2000) dimension ku_swh_1(2000,2000), m_per_1(2000,2000) dimension sd_per_1(2000,2000), sk_per_1(2000,2000) dimension ku_per_1(2000,2000), m_we_1(2000,2000) dimension sd_we_1(2000,2000),sk_we_1(2000,2000),ku_we_1(2000,2000) character*103 none integer iyear,imon,iday,ihb,ihs,ihstep real aslat, anlat, awlon, aelon, res aslat = 33.0 anlat = 37.0 awlon = 31.0 aelon = 36.0 res = 0.1 CCCCCCC Definition of nx, ny - points on x, y - axis CCCC nx = nint(abs((aelon-awlon))/res + 1) ny = nint((anlat-aslat)/res + 1) write (*,*) 'lon=', AWLON, 'to', AELON write (*,*) 'lat=', ASLAT, 'to', ANLAT write (*,*) 'resolution=', res write (*,*) 'nx=', nx, 'ny=', ny CCCCCCCCCCCCCCCCCCCCCCCCCCCCCCCCCCCCCCCCCCCCCCCCCCCCCCCCC do j = 1, ny mu_1(j,i)= sigma_1(j,i)= m_swh_1(j,i)= sd_swh_1(j,i)= sk_swh_1(j,i)= ku_swh_1(j,i)= m_per_1(j,i)= sd_per_1(j,i)= sk_per_1(j,i)= ku_per_1(j,i)= m_we_1(j,i)= sd_we_1(j,i)= sk_we_1(j,i)= ku_we_1(j,i)= enddo 2
166 enddo open (unit=10, file='./stats_final_warm', status='old')!initial file open (unit=20, file='./mu.txt', status='new')!new file open (unit=30, file='./sigma.txt', status='new')!new file open (unit=40, file='./m_swh.txt', status='new')!new file open (unit=50, file='./sd_swh.txt', status='new')!new file open (unit=60, file='./sk_swh.txt', status='new')!new file open (unit=70, file='./ku_swh.txt', status='new')!new file open (unit=80, file='./m_per.txt', status='new')!new file open (unit=90, file='./sd_per.txt', status='new')!new file open (unit=100, file='./sk_per.txt', status='new')!new file open (unit=110, file='./ku_per.txt', status='new')!new file open (unit=120, file='./m_we.txt', status='new')!new file open (unit=130, file='./sd_we.txt', status='new')!new file open (unit=140, file='./sk_we.txt', status='new')!new file open (unit=150, file='./ku_we.txt', status='new')!new file do i=1,2 read (10,*) none enddo itest = 1 do l=1,ny clat = aslat + res*(l-1) do k=1,nx clon = awlon + res*(k-1)!! write (*,*) 'clat=', clat!! write (*,*) 'clon=', clon if (itest.gt.0) then read (10,*,ioStat=status) lon, lat, mu, sigma, m_swh, sd_swh, & sk_swh, ku_swh, m_per, sd_per, sk_per, ku_per, m_we, sd_we, & sk_we, ku_we endif if ((abs(lat-clat).le.0.1).and. + (abs(lon-clon).le.0.1)) then!!! write (*,*) 'match', clon, lon, clat, lat-clat mu_1(l,k)=mu sigma_1(l,k)=sigma m_swh_1(l,k)=m_swh sd_swh_1(l,k)=sd_swh sk_swh_1(l,k)=sk_swh ku_swh_1(l,k)=ku_swh m_per_1(l,k)=m_per sd_per_1(l,k)=sd_per 3
167 sk_per_1(l,k)=sk_per ku_per_1(l,k)=ku_per m_we_1(l,k)=m_we sd_we_1(l,k)=sd_we sk_we_1(l,k)=sk_we ku_we_1(l,k)=ku_we itest = 1 else!!! write (*,*) 'not matched', clon, lon, clat, lat-clat mu_1(l,k)= sigma_1(l,k)= m_swh_1(l,k)= sd_swh_1(l,k)= sk_swh_1(l,k)= ku_swh_1(l,k)= m_per_1(l,k)= sd_per_1(l,k)= sk_per_1(l,k)= ku_per_1(l,k)= m_we_1(l,k)= sd_we_1(l,k)= sk_we_1(l,k)= ku_we_1(l,k)= itest = -1 endif enddo enddo do l=1,ny write (20,4000) (mu_1(l,k), k=1,nx) enddo do l=1,ny write (30,4000) (sigma_1(l,k), k=1,nx) enddo do l=1,ny write (40,4000) (m_swh_1(l,k), k=1,nx) enddo do l=1,ny write (50,4000) (sd_swh_1(l,k), k=1,nx) enddo do l=1,ny write (60,4000) (sk_swh_1(l,k), k=1,nx) enddo do l=1,ny write (70,4000) (ku_swh_1(l,k), k=1,nx) enddo 4
168 do l=1,ny write (80,4000) (m_per_1(l,k), k=1,nx) enddo do l=1,ny write (90,4000) (sd_per_1(l,k), k=1,nx) enddo do l=1,ny write (100,4000) (sk_per_1(l,k), k=1,nx) enddo do l=1,ny write (110,4000) (ku_per_1(l,k), k=1,nx) enddo do l=1,ny write (120,4000) (m_we_1(l,k), k=1,nx) enddo do l=1,ny write (130,4000) (sd_we_1(l,k), k=1,nx) enddo do l=1,ny write (140,4000) (sk_we_1(l,k), k=1,nx) enddo do l=1,ny write (150,4000) (ku_we_1(l,k), k=1,nx) enddo close (10) close (20) close (30) close (40) close (50) close (60) close (70) close (80) close (90) close (100) close (110) close (120) close (130) close (140) close (150) 4000 Format (10f8.2) stop 5
169 end #!/bin/bash ll_wave_graphics_stat.sh: date RUN_DIR=/mnt/data/ggalanis/Postprocess/Domain/CHRISKAL #RUN_DIR=/mnt/data/chriskal/RAMSICEX/NCL_CYPRUS_2ndYEAR/WAM_STAT/Domain IMAGEDIR=$RUN_DIR/IMAGES cd $RUN_DIR for PARAM in ku_swh sk_swh m_swh sd_swh ku_per sk_per m_per sd_per ku_we sk_we m_we sd_we mu sigma; do #for PARAM in Kappa ku_swh sk_swh m_swh sd_swh ku_per sk_per m_per sd_per ku_we sk_we m_we sd_we mu sigma; do echo ' &INPUTFN' > waves_in echo ' ' >> waves_in echo "FILNAM1='$PARAM.txt'" >> waves_in cat $RUN_DIR/waves_in.2 >> waves_in $RUN_DIR/cont_$PARAM /usr/local/ncarg/bin/ctrans -dev ps.color -f /usr/local/ncarg/lib/ncarg/fontcaps/font12 gmeta > 1.ps /usr/bin/convert -trim -density 288 +antialias -scale 680x680 -depth 8 +dither -colors ps $PARAM.png mv $RUN_DIR/*png $IMAGEDIR done date 6


170 APPENDIX 25 E-Wave: Integrated High Resolution System for Monitoring and Quantifying the Wave Energy Potential in the EEZ of Cyprus Deliverable No. 15 The data base of the E-Wave project Technical Report July 2012
171 The need for efficient and effective data management is greatly recognized today by the research and technical community. The Cyprus Oceanography Center within the framework of the E-wave project has set up a new data base scheme in which the 10-year simulation results obtained from the runs of the atmospheric (Skiron/Eta) and wave (WAM) model have being compiled. Main statistical parameters for the wave energy potential in the EEZ of Cyprus, as simulated by the models developed, for the period are included in the stored data. The data base has been built based on the Live Access Server (LAS) which is a highly configurable web server, developed by the National Oceanic and Atmospheric Administration (NOAA) of the USA, designed to provide flexible access to geo-referenced scientific data. The electronic data base has been set up in the infrastructure of the Oceanography Center of the University of Cyprus and can be reached at A detailed description of the system and its capabilities follows. 1

172 LIVE ACCESS SERVER Implementation Configuration A Live Access Server (LAS) is a highly configurable web server designed to provide flexible access to geo-referenced scientific data. It can present distributed data sets as a unified virtual data base through the use of OPeNDAP networking infrastructure. The default visualization application used by LAS is Ferret, though other applications can also be used as Matlab, IDL, GrADS. For the E-Wave project, a LAS has been built on an Intel(R) Core(TM) i7 CPU 3.20GHz server with 8GB of RAM. A complete system must also include the Ferret environment, Thredds Data Server (TDS), Xampp and Tomcat. First thing installed is Java (SE JDK) and the ant package (Java based build tool like make), followed by XAMPP and Tomcat. The two servers are configured to allow the communication between them with the mod_jk module which is the Tomcat-Apache plug-in that handles the communication between Tomcat and Apache. This will let us connect to LAS server running on Tomcat through the Apache web server at port 80. For the data to be available to LAS, Thredds Data Server (TDS) was installed. When LAS starts, automatically builds the necessary Ferret journal files that will allow TDS to serve the data from our LAS via OPeNDAP. The TDS server must be configured for the location of the data and temporary files. The data that shared using LAS are available from data sources which can be read via the NetCDF API. These data are available via an OPeNDAP server and are further organized into a THREDDS catalog. Next, the Ferret environment was installed and tested. Ferret is the visualization tool that LAS server uses to create the outputs. Finally we configured and installed the LAS. LAS Architecture The main Web applications in LAS are the Product Server and the UI Server. The Product Server takes in the LAS client request (typically an Ajax application running in a browser), breaks the request apart and farms out the work necessary to build the product to one or more backend services, collects the results from the services and forwards the response back to the client. The User Interface Server consists of a collection of action classes that can respond with information about LAS configuration from which a client can construct a User Interface. In other words, in order to populate a GUI for interacting with LAS you need to be able to ask the server about what data sets, variables, views, and operations (together with their options) are available. 2
. These services are deployed as Simple Object Access Protocol (SOAP) services using Apache axis.")
, compare (difference) variables from distributed locations, use Google Earth to visualize data and easily create")
173 The Backend Services are plain ordinary java objects with one method, the receiving of a string argument (that is an XML Backend Request) and the return of a single string argument (an XML Backend Response). These services are deployed as Simple Object Access Protocol (SOAP) services using Apache axis. LAS user interface LAS server runs on Tomcat and the users through the LAS interface have the ability to visualize data with on-the-fly graphics, request custom subsets of variables in a choice of file formats, access background reference material about the data (metadata), compare (difference) variables from distributed locations, use Google Earth to visualize data and easily create animations. LAS server enables the research team to quickly visualize and collect subsets and derived products on the fly from locations physically distant from the server. This is particularly useful for sharing of the large data set and calculation of wave quantities. Time series plot of the significant wave height (m) from year Example plot showing the Wave Period of year 2001 from E- Wave Project. Reference NOAA/OAR/PMEL- Pacific Marine Environmental Laboratory Live Access Server [online]. [Accessed 03 July 2012]. Available from: 3
174 APPENDIX 26 In this Appendix, the results obtained within the framework of the Ewave project for the wave power potential in the sea area of Cyprus as well as the significant wave height and mean wave period, which are the main wave parameters that affect it, are analyzed by means of the following statistical indexes: Mean value, Standard deviation, Skeweness and Kurtosis. These are the main statistical indexes describing the full wave and energy atlases that are available in electronic form at:
175 Wave model domains
176 Main statistical parameters regarding the available wave energy potential (Kw/m) for the Eastern Mediterranean. The 10year a) mean b) Standard deviation c) Skewness d) Kurtosis values.
177 Main statistical parameters regarding the energy wave period (sec) for the Eastern Mediterranean. The 10year a) mean b) Standard deviation c) Skewness d) Kurtosis values.
178 The yearly evolution of the mean wave energy potential for the western coasts of Cyprus.
179 The yearly evolution of the Standard Deviation of wave energy potential for the western coasts of Cyprus.
180 Main statistical parameters regarding the significant wave height (m) for the Eastern Mediterranean. The 10year a) mean b) Standard deviation c) Skewness d) Kurtosis values.
181 Annual Mean Wave Energy Potential for the years
182 Annual Standard Deviation of the Wave Energy Potential for the years
183 Annual Skewness of the Wave Energy Potential for the years
184 Annual Kurtosis of the Wave Energy Potential for the years
185 Mean Significant Wave Height for the years
186 Standard Deviation of the Significant Wave Height for the years
187 Skeness of the Significant Wave Height for the years
188 Kurtosis of the Significant Wave Height for the years
189 Annual Mean Wave Period for the years
190 Standard Deviation of the Wave Period for the years
191 Skeness of the Wave Period for the years
192 Kurtosis of the Wave Period for the years
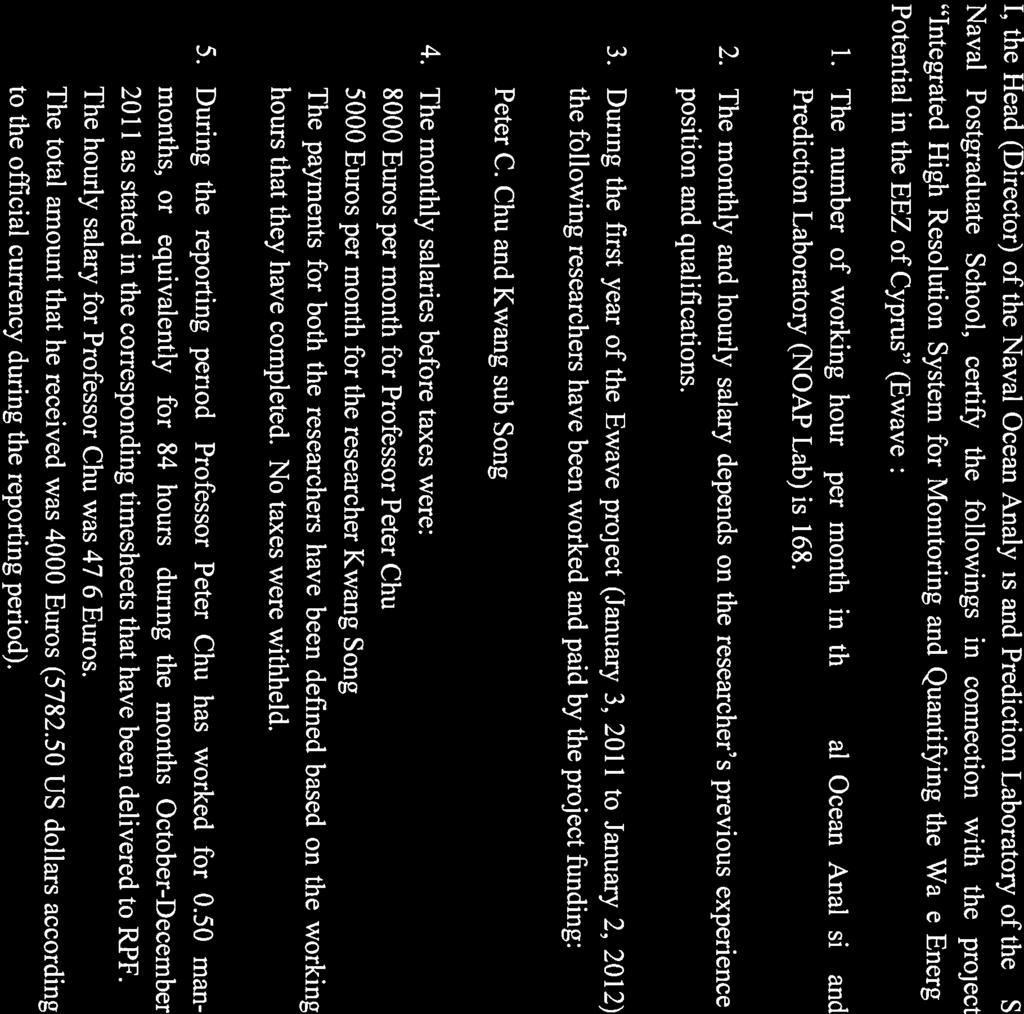

193
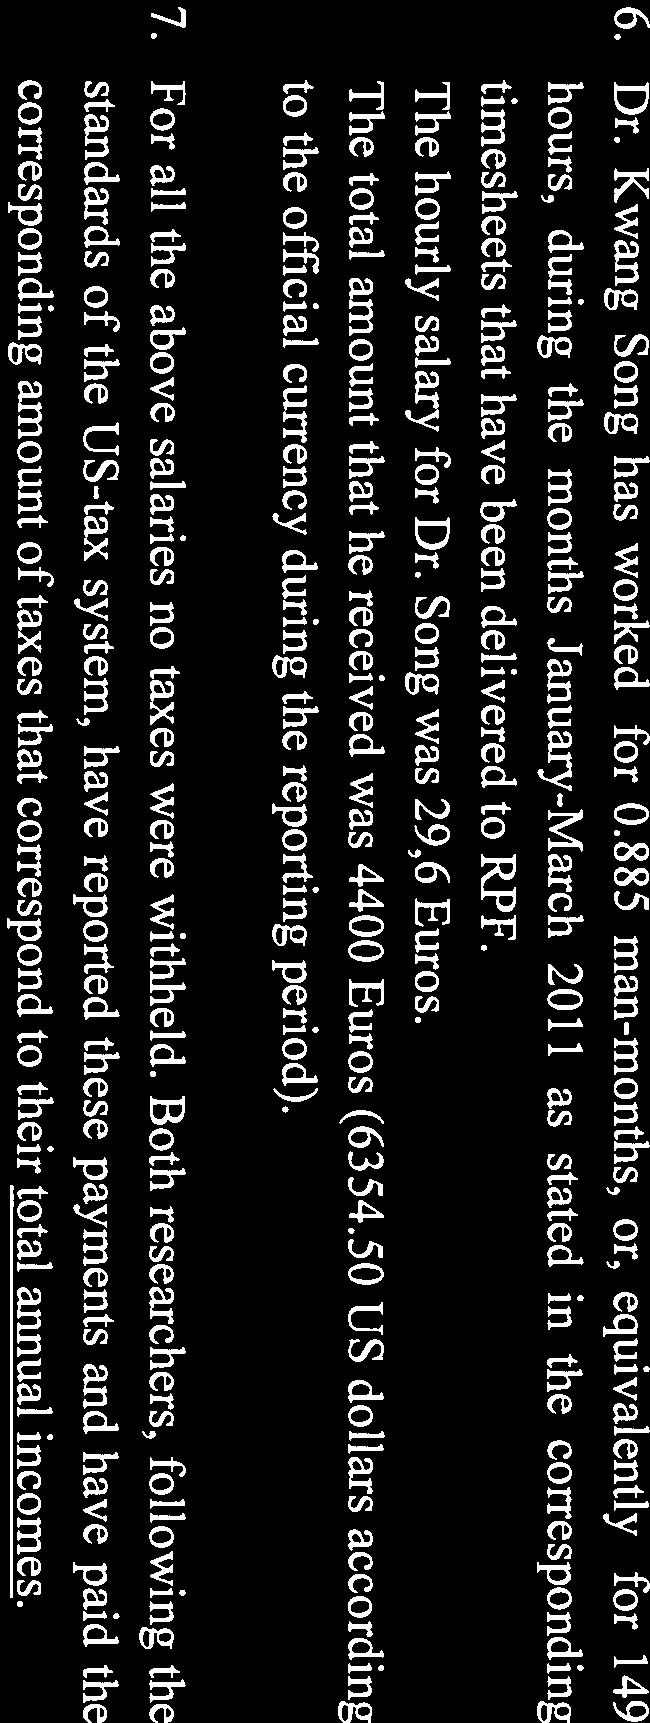
194


195


196
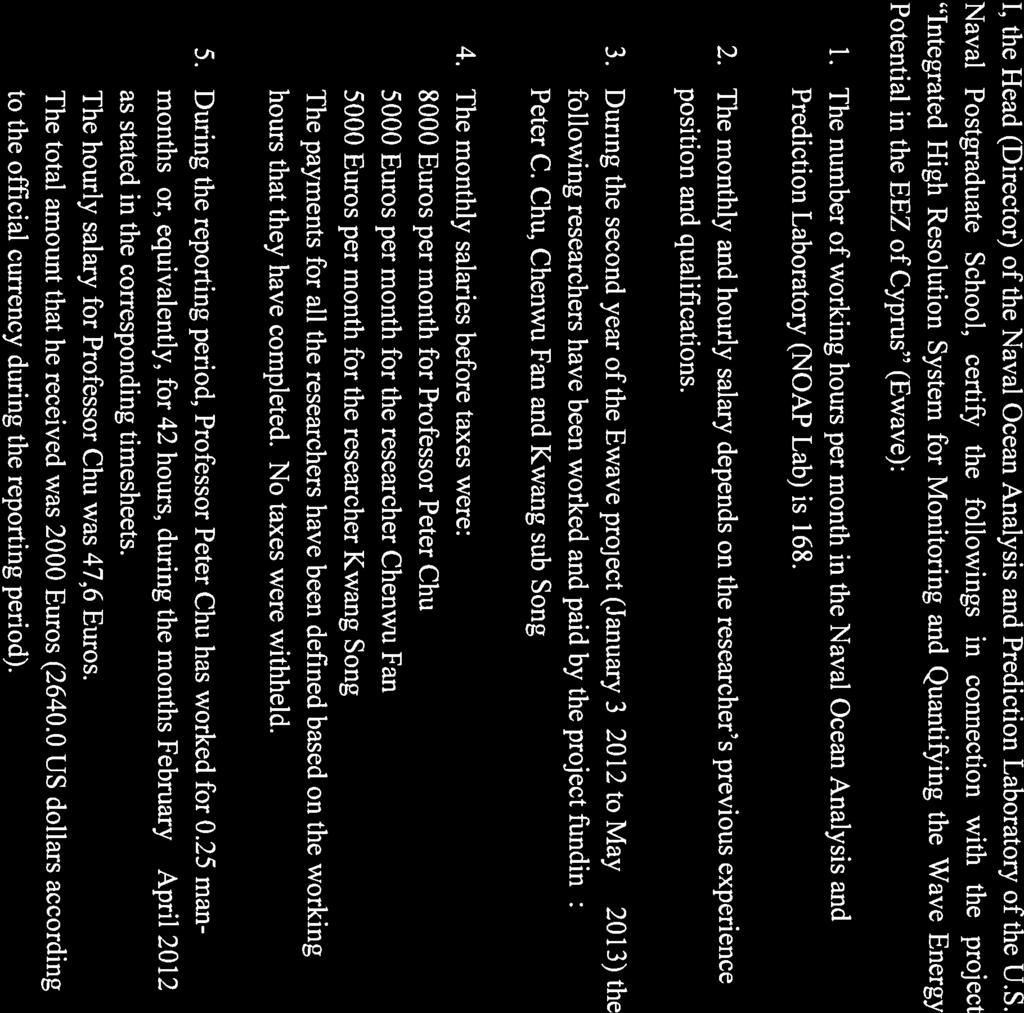

197
198
199
200

201
202


203
204
205


206

207


208
209
210

211

212


213


214

215

216
217 ΚΤΠΡΙΑΚΗ ΔΗΜΟΚΡΑΣΙΑ ΕΤΡΩΠΑΪΚΗ ΕΝΩΗ Η ΔΕΜΗ 2008 ΤΓΥΡΗΜΑΣΟΔΟΣΕΙΣΑΙ ΑΠΟ ΣΗΝ ΚΤΠΡΙΑΚΗ ΔΗΜΟΚΡΑΣΙΑ ΚΑΙ ΣΟ ΕΤΡΩΠΑΪΚΟ ΣΑΜΕΙΟ ΠΕΡΙΦΕΡΕΙΑΚΗ ΑΝΑΠΣΤΞΗ ΣΗ ΕΕ Α.3. ΑΙΣΗΗ ΓΙΑ ΑΛΛΑΓΗ ΣΗ ΤΝΘΕΗ ΕΡΕΤΝΗΣΙΚΗ ΟΜΑΔΑ Ε ΕΡΓΟ ΣΗ ΔΕΜΗ ΓΕΝΙΚΑ ΣΟΙΥΕΙΑ ΕΡΓΟΤ Απιθμόρ Ππ. Έπγος: ΤΕΧΝΟΛΟΓΙΑ/ΕΝΕΡΓ/0609(ΒΙΕ)/01 Σίηλορ Έπγος: Integrated High Resolution System for Monitoring and Quantifying the Wave Energy Potential in the EEZ of Cyprus ςνηονιζηήρ Έπγος: Dr George Zodiates Διάπκεια Έπγος 24 κήλεο Ανάδοσορ Φοπέαρ: ΩΚΕΑΝΟΓΡΑΦΙΚΟ ΚΕΝΣΡΟ, ΠΑΝΕΠΙΣΗΜΙΟ ΚΤΠΡΟΤ Ημεπ. Έναπξηρ 03/01/11 Ημεπομηνία : 01/07/ ΣΟΙΥΕΙΑ ΠΡΟΩΠΟΤ ΠΡΟ ΑΝΣΙΚΑΣΑΣΑΗ Ονομαηεπώνςμο ΥΡΙΣΙΝΑ ΜΗΣΑΚΟΤ Σίηλορ Δξ. Φπζηθήο Φοπέαρ Επγαζίαρ ΟΜΑΔΑ ΑΣΜΟΦΑΙΡΙΚΩΝ ΜΟΝΣΕΛΩΝ ΚΑΙ ΠΡΟΓΝΩΗ ΚΑΙΡΟΤ, ΠΑΝΕΠΙΣΗΜΙΟ ΑΘΗΝΩΝ 3. ΣΟΙΥΕΙΑ ΝΕΟΤ ΜΕΛΟΤ ΕΡΕΤΝΗΣΙΚΗ ΟΜΑΔΑ Ονομαηεπώνςμο ΠΑΝΑΓΙΩΣΗ ΑΘΑΝΑΙΑΔΗ Σίηλορ Φοπέαρ Επγαζίαρ Διεύθςνζη Ηλεκη. Σασςδπομείο Δξ. Μεηεωξνινγίαο ΟΜΑΔΑ ΑΣΜΟΦΑΙΡΙΚΩΝ ΜΟΝΣΕΛΩΝ ΚΑΙ ΠΡΟΓΝΩΗ ΚΑΙΡΟΤ, ΠΑΝΕΠΙΣΗΜΙΟ ΑΘΗΝΩΝ Εζληθό & Καπνδηζηξηαθό Παλεπηζηήκην Αζελώλ, Σκήκα Φπζηθήο, Σνκέαο Φπζηθήο Πεξηβάιινληνο Μεηεωξνινγίαο, Κηήξην ΦΤΙΚΗ V, Αζήλα, Ειιάδα panos@mg.uoa.gr Σηλέθωνο Σηλεομοιόηςπο Σ. Σ
218 ΚΤΠΡΙΑΚΗ ΔΗΜΟΚΡΑΣΙΑ ΕΤΡΩΠΑΪΚΗ ΕΝΩΗ Η ΔΕΜΗ 2008 ΤΓΥΡΗΜΑΣΟΔΟΣΕΙΣΑΙ ΑΠΟ ΣΗΝ ΚΤΠΡΙΑΚΗ ΔΗΜΟΚΡΑΣΙΑ ΚΑΙ ΣΟ ΕΤΡΩΠΑΪΚΟ ΣΑΜΕΙΟ ΠΕΡΙΦΕΡΕΙΑΚΗ ΑΝΑΠΣΤΞΗ ΣΗ ΕΕ Ο θνο Πάλνο Αζαλαζηάδεο έρεη κεηαπηπρηαθέο ζπνπδέο (ζε επίπεδν Ph.D. θαη M.Sc.) ζε ζέκαηα Μεηεωξνινγίαο θαη Φπζηθήο Πεξηβάιινληνο. Έρεη εξγαζηεί θαηά ην παξειζόλ ζε εξεπλεηηθά πξνγξάκκαηα, ζε ζπλαθή ηνπ E-wave project αληηθείκελα, ζην University of Reading, UK θαη ζην University of Washington, USA. Έρεη επίζεο εθηεηακέλε εκπεηξία ζε επηζηεκνληθό πξνγξακκαηηζκό θαη αξηζκεηηθά κνληέια πξνζνκνίωζεο κεηεωξνινγηθώλ δηεξγαζηώλ. Επηζπλάπηεηαη πιήξεο βηνγξαθηθό ζεκείωκα ηνπ Νένπ Μέινπο. 4 ΑΙΣΙΑ ΑΝΣΙΚΑΣΑΣΑΗ Η θπξία Μεηζάθνπ ελεκέξωζε όηη ζα απνρωξήζεη από ηελ Εξεπλεηηθή Οκάδα ηνπ Παλεπηζηεκίνπ Αζελώλ ζην ηέινο Οθηωβξίνπ Γηα ηε θαιύηεξε εθηέιεζε ηνπ έξγνπ (ηήξεζε ρξνλνδηαγξακκάηωλ, παξαδνηέα) πξνζειήθζε γηα παξάιιειε απαζρόιεζε καδί κε ηε Δξ Μεηζάθνπ ν Δξ Π. Αζαλαζηάδεο γηα ην ρξνληθό δηάζηεκα 1 Ινπιίνπ 31 Απγνύζηνπ Ο θύξηνο Αζαλαζηάδεο δηαζέηεη ηα ίδηα πξνζόληα κε ηε θπξία Μεηζάθνπ. Σν πνζόλ πνπ είρε πξνϋπνινγηζηεί γηα ηε θπξία Μεηζάθνπ θαηαλεκήζεθε κεηαμύ ηεο θαη κε ην θύξην Αζαλαζηάδε ωο εμήο: Μεηζάθνπ Υξηζηίλα ΕΤΡΩ Αζαλαζηάδεο Παλαγηώηεο ΕΤΡΩ ΤΝΟΛΟ ΔΑΠΑΝΩΝ ΠΡΟΩΠΙΚΟΤ: ΕΤΡΩ. Αληίζηνηρα, νη 4,8 αλζξωπνκήλεο πνπ είραλ πξνϋπνινγηζηεί γηα ηελ θ. Μεηζάθνπ θαηαλεκήζεθαλ ωο εμήο: Μεηζάθνπ Υξηζηίλα 2,72 αλζξωπνκήλεο Αζαλαζηάδεο Παλαγηώηεο 2,08 αλζξωπνκήλεο Οη ινηπέο δαπάλεο ηνπ έξγνπ (ακνηβέο ηνπ ινηπνύ πξνζωπηθνύ θιπ) παξακέλνπλ αλαιινίωηεο. 5. ΤΛΟΠΟΙΗΗ ΕΡΓΟΤ Οη παξαπάλω αιιαγέο ζηε θαηαλνκή ηωλ δαπαλώλ δελ δεκηνπξγνύλ θαλέλα δηαρεηξηζηηθό πξόβιεκα γηαηί νη εξγαζίεο εθηειέζηεθαλ από ίδηαο θαηεγνξίαο θαη εηδηθόηεηαο πξνζωπηθό ελώ ηα παξαδνηέα νινθιεξώλνληαη θαλνληθά ζύκθωλα κε ην ρξνλνδηάγξακκα


219 ΚΤΠΡΙΑΚΗ ΔΗΜΟΚΡΑΣΙΑ ΕΤΡΩΠΑΪΚΗ ΕΝΩΗ 6. ΥΟΛΙΑ ΙΠΕ Η ΔΕΜΗ 2008 ΤΓΥΡΗΜΑΣΟΔΟΣΕΙΣΑΙ ΑΠΟ ΣΗΝ ΚΤΠΡΙΑΚΗ ΔΗΜΟΚΡΑΣΙΑ ΚΑΙ ΣΟ ΕΤΡΩΠΑΪΚΟ ΣΑΜΕΙΟ ΠΕΡΙΦΕΡΕΙΑΚΗ ΑΝΑΠΣΤΞΗ ΣΗ ΕΕ Μόνο για σπήζη από ηο ΙΠΕ. Παπακαλώ μη ζςμπληπώνεηε. Απμόδιορ Λειηοςπγόρ ΙΠΕ Ημεπ/νια
220 ΚΤΠΡΙΑΚΗ ΔΗΜΟΚΡΑΣΙΑ ΕΤΡΩΠΑΪΚΗ ΕΝΩΗ Η ΔΕΜΗ 2008 ΤΓΥΡΗΜΑΣΟΔΟΣΕΙΣΑΙ ΑΠΟ ΣΗΝ ΚΤΠΡΙΑΚΗ ΔΗΜΟΚΡΑΣΙΑ ΚΑΙ ΣΟ ΕΤΡΩΠΑΪΚΟ ΣΑΜΕΙΟ ΠΕΡΙΦΕΡΕΙΑΚΗ ΑΝΑΠΣΤΞΗ ΣΗ ΕΕ Α.3. ΑΙΣΗΗ ΓΙΑ ΑΛΛΑΓΗ ΣΗ ΤΝΘΕΗ ΕΡΕΤΝΗΣΙΚΗ ΟΜΑΔΑ Ε ΕΡΓΟ ΣΗ ΔΕΜΗ ΓΕΝΙΚΑ ΣΟΙΥΕΙΑ ΕΡΓΟΤ Απιθμόρ Ππ. Έπγος: ΤΕΧΝΟΛΟΓΙΑ/ΕΝΕΡΓ/0609(ΒΙΕ)/01 Σίηλορ Έπγος: Integrated High Resolution System for Monitoring and Quantifying the Wave Energy Potential in the EEZ of Cyprus ςνηονιζηήρ Έπγος: Dr George Zodiates Διάπκεια Έπγος 24 κήλεο Ανάδοσορ Φοπέαρ: ΩΚΕΑΝΟΓΡΑΦΙΚΟ ΚΕΝΣΡΟ, ΠΑΝΕΠΙΣΗΜΙΟ ΚΤΠΡΟΤ Ημεπ. Έναπξηρ 03/01/11 Ημεπομηνία : 01/07/ ΣΟΙΥΕΙΑ ΠΡΟΩΠΟΤ ΠΡΟ ΑΝΣΙΚΑΣΑΣΑΗ Ονομαηεπώνςμο ΠΑΝΑΓΙΩΣΗ ΑΘΑΝΑΙΑΔΗ Σίηλορ Δξ. Μεηεσξνινγίαο ΟΜΑΔΑ ΑΣΜΟΦΑΙΡΙΚΩΝ ΜΟΝΣΕΛΩΝ ΚΑΙ ΠΡΟΓΝΩΗ ΚΑΙΡΟΤ, Φοπέαρ Επγαζίαρ ΠΑΝΕΠΙΣΗΜΙΟ ΑΘΗΝΩΝ 3. ΣΟΙΥΕΙΑ ΝΕΟΤ ΜΕΛΟΤ ΕΡΕΤΝΗΣΙΚΗ ΟΜΑΔΑ Ονομαηεπώνςμο ΥΡΗΣΟ ΠΤΡΟΤ Σίηλορ Φοπέαρ Επγαζίαρ Διεύθςνζη Ηλεκη. Σασςδπομείο Δξ. Μεηεσξνινγίαο ΟΜΑΔΑ ΑΣΜΟΦΑΙΡΙΚΩΝ ΜΟΝΣΕΛΩΝ ΚΑΙ ΠΡΟΓΝΩΗ ΚΑΙΡΟΤ, ΠΑΝΕΠΙΣΗΜΙΟ ΑΘΗΝΩΝ Εζληθό & Καπνδηζηξηαθό Παλεπηζηήκην Αζελώλ, Σκήκα Φπζηθήο, Σνκέαο Φπζηθήο Πεξηβάιινληνο Μεηεσξνινγίαο, Κηήξην ΦΤΙΚΗ V, Αζήλα, Ειιάδα cspir@mg.uoa.gr Σηλέθωνο Σηλεομοιόηςπο Σ. Σ
221 ΚΤΠΡΙΑΚΗ ΔΗΜΟΚΡΑΣΙΑ ΕΤΡΩΠΑΪΚΗ ΕΝΩΗ Η ΔΕΜΗ 2008 ΤΓΥΡΗΜΑΣΟΔΟΣΕΙΣΑΙ ΑΠΟ ΣΗΝ ΚΤΠΡΙΑΚΗ ΔΗΜΟΚΡΑΣΙΑ ΚΑΙ ΣΟ ΕΤΡΩΠΑΪΚΟ ΣΑΜΕΙΟ ΠΕΡΙΦΕΡΕΙΑΚΗ ΑΝΑΠΣΤΞΗ ΣΗ ΕΕ Ο Κνο Υξήζηνο πύξνπ έρεη κεηαπηπρηαθέο ζπνπδέο (ζε επίπεδν Ph.D. θαη M.Sc.) ζε ζέκαηα Μεηεσξνινγίαο θαη Φπζηθήο Πεξηβάιινληνο. Έρεη εξγαζηεί θαηά ην παξειζόλ ζε εξεπλεηηθά πξνγξάκκαηα, ζε ζπλαθή ηνπ E-wave project αληηθείκελα ζηελ Οκάδα Αηκνζθαηξηθώλ Μνληέισλ θαη Πξόγλσζεο Καηξνύ ηνπ Παλεπηζηεκίνπ Αζελώλ. Έρεη δεκνζηεύζεη αξηζκό άξζξσλ ζε ζέκαηα Μεηεσξνινγίαο θαη εθαξκνγώλ ελώ έρεη κεγάιε εκπεηξία ζε επηζηεκνληθό πξνγξακκαηηζκό θαη αξηζκεηηθά κνληέια πξνζνκνίσζεο κεηεσξνινγηθώλ δηεξγαζηώλ. Επηζπλάπηεηαη πιήξεο βηνγξαθηθό ζεκείσκα ηνπ λένπ κέινπο. 4 ΑΙΣΙΑ ΑΝΣΙΚΑΣΑΣΑΗ Η κεγάιε θαζπζηέξεζε ζηελ θαηαβνιή ηεο δεύηεξεο δόζεο ρξεκαηνδόηεζεο από ην Ίδξπκα Πξνώζεζεο Έξεπλαο (ΙΠΕ) είρε σο ζπλέπεηα λα δεκηνπξγεζεί ηεξάζηην πξόβιεκα ζηε δηαρείξηζε ηνπ έξγνπ θαζώο νη εξεπλεηέο πνπ εξγαδόηαλ ζηελ νκάδα καο γηα ην ζπγθεθξηκέλν έξγν έκεηλαλ ρσξίο ακνηβή γηα εμαηξεηηθά κεγάιν ρξνληθό δηάζηεκα θαη απνρώξεζαλ. Παξ όια απηά ε Οκάδα Αηκνζθαηξηθώλ Μνληέισλ θαη Πξόγλσζεο Καηξνύ ηνπ Παλεπηζηεκίνπ Αζελώλ θαηέβαιε θάζε δπλαηή πξνζπάζεηα γηα ηελ νινθιήξσζε ηνπ έξγνπ πξνρσξώληαο ζηελ πξόζιεςε λέσλ εξεπλεηώλ κε ηζνδύλακα ή θαη αλώηεξα πξνζόληα νη νπνίνη δέρηεθαλ λα εξγαζηνύλ θαη λα πιεξσζνύλ όηαλ ην ΙΠΕ αληαπνθξηζεί ζηνπο όξνπο ρξεκαηνδόηεζεο ηνπ έξγνπ. ηελ πξνθεηκέλε πεξίπησζε ν θ. πύξνπ δηαζέηεη θαιύηεξα ηππηθά θαη νπζηαζηηθά πξνζόληα από απηά ηνπ πξνθαηόρνπ ηνπ θ. Αζαλαζηάδε. ηνλ θ. πύξνπ κεηαθέξνληαη νη 0,72 αλζξσπνκήλεο πνπ δελ είραλ θαιπθζεί από ηνλ θ. Αζαλαζηάδε βάζεη ηνπ πξνεγνύκελνπ πξνϋπνινγηζκνύ. 5. ΤΛΟΠΟΙΗΗ ΕΡΓΟΤ Οη παξαπάλσ αιιαγέο ζηε θαηαλνκή ησλ δαπαλώλ δελ δεκηνπξγνύλ θαλέλα δηαρεηξηζηηθό πξόβιεκα γηαηί νη εξγαζίεο εθηειέζηεθαλ από ίδηαο θαηεγνξίαο θαη εηδηθόηεηαο πξνζσπηθό ελώ ηα παξαδνηέα νινθιεξώζεθαλ θαλνληθά ζύκθσλα κε ην ρξνλνδηάγξακκα
222 ΚΤΠΡΙΑΚΗ ΔΗΜΟΚΡΑΣΙΑ ΕΤΡΩΠΑΪΚΗ ΕΝΩΗ 6. ΥΟΛΙΑ ΙΠΕ Η ΔΕΜΗ 2008 ΤΓΥΡΗΜΑΣΟΔΟΣΕΙΣΑΙ ΑΠΟ ΣΗΝ ΚΤΠΡΙΑΚΗ ΔΗΜΟΚΡΑΣΙΑ ΚΑΙ ΣΟ ΕΤΡΩΠΑΪΚΟ ΣΑΜΕΙΟ ΠΕΡΙΦΕΡΕΙΑΚΗ ΑΝΑΠΣΤΞΗ ΣΗ ΕΕ Μόνο για σπήζη από ηο ΙΠΕ. Παπακαλώ μη ζςμπληπώνεηε. Απμόδιορ Λειηοςπγόρ ΙΠΕ Ημεπ/νια
223 ΚΤΠΡΙΑΚΗ ΔΗΜΟΚΡΑΣΙΑ ΕΤΡΩΠΑΪΚΗ ΕΝΩΗ Η ΔΕΜΗ 2008 ΤΓΥΡΗΜΑΣΟΔΟΣΕΙΣΑΙ ΑΠΟ ΣΗΝ ΚΤΠΡΙΑΚΗ ΔΗΜΟΚΡΑΣΙΑ ΚΑΙ ΣΟ ΕΤΡΩΠΑΪΚΟ ΣΑΜΕΙΟ ΠΕΡΙΦΕΡΕΙΑΚΗ ΑΝΑΠΣΤΞΗ ΣΗ ΕΕ Α.3. ΑΙΣΗΗ ΓΙΑ ΑΛΛΑΓΗ ΣΗ ΤΝΘΕΗ ΕΡΕΤΝΗΣΙΚΗ ΟΜΑΔΑ Ε ΕΡΓΟ ΣΗ ΔΕΜΗ ΓΕΝΙΚΑ ΣΟΙΥΕΙΑ ΕΡΓΟΤ Απιθμόρ Ππ. Έπγος: ΤΕΧΝΟΛΟΓΙΑ/ΕΝΕΡΓ/0609(ΒΙΕ)/01 Σίηλορ Έπγος: Integrated High Resolution System for Monitoring and Quantifying the Wave Energy Potential in the EEZ of Cyprus ςνηονιζηήρ Έπγος: Dr George Zodiates Διάπκεια Έπγος 24 κήλεο Ανάδοσορ Φοπέαρ: ΩΚΕΑΝΟΓΡΑΦΙΚΟ ΚΕΝΣΡΟ, ΠΑΝΕΠΙΣΗΜΙΟ ΚΤΠΡΟΤ Ημεπ. Έναπξηρ 03/01/11 Ημεπομηνία : 01/07/ ΣΟΙΥΕΙΑ ΠΡΟΩΠΟΤ ΠΡΟ ΑΝΣΙΚΑΣΑΣΑΗ Ονομαηεπώνςμο ΙΩΑΝΝΗ ΑΘΑΝΑΕΛΛΗ Σίηλορ B.Sc. Computer Science ΟΜΑΔΑ ΑΣΜΟΦΑΙΡΙΚΩΝ ΜΟΝΣΕΛΩΝ ΚΑΙ ΠΡΟΓΝΩΗ ΚΑΙΡΟΤ, Φοπέαρ Επγαζίαρ ΠΑΝΕΠΙΣΗΜΙΟ ΑΘΗΝΩΝ 3. ΣΟΙΥΕΙΑ ΝΕΟΤ ΜΕΛΟΤ ΕΡΕΤΝΗΣΙΚΗ ΟΜΑΔΑ Ονομαηεπώνςμο ΥΡΙΣΙΝΑ ΚΑΛΟΓΕΡΗ Σίηλορ Φοπέαρ Επγαζίαρ Διεύθςνζη Ηλεκη. Σασςδπομείο M. Sc. Φπζηθήο Πεξηβάιινληνο ΟΜΑΔΑ ΑΣΜΟΦΑΙΡΙΚΩΝ ΜΟΝΣΕΛΩΝ ΚΑΙ ΠΡΟΓΝΩΗ ΚΑΙΡΟΤ, ΠΑΝΕΠΙΣΗΜΙΟ ΑΘΗΝΩΝ Εζληθό & Καπνδηζηξηαθό Παλεπηζηήκην Αζελώλ, Σκήκα Φπζηθήο, Σνκέαο Φπζηθήο Πεξηβάιινληνο Μεηεσξνινγίαο, Κηήξην ΦΤΙΚΗ V, Αζήλα, Ειιάδα chriskal@mg.uoa.gr Σηλέθωνο Σηλεομοιόηςπο Σ. Σ
224 ΚΤΠΡΙΑΚΗ ΔΗΜΟΚΡΑΣΙΑ ΕΤΡΩΠΑΪΚΗ ΕΝΩΗ Η ΔΕΜΗ 2008 ΤΓΥΡΗΜΑΣΟΔΟΣΕΙΣΑΙ ΑΠΟ ΣΗΝ ΚΤΠΡΙΑΚΗ ΔΗΜΟΚΡΑΣΙΑ ΚΑΙ ΣΟ ΕΤΡΩΠΑΪΚΟ ΣΑΜΕΙΟ ΠΕΡΙΦΕΡΕΙΑΚΗ ΑΝΑΠΣΤΞΗ ΣΗ ΕΕ Η Κα Καινγεξή έρεη κεηαπηπρηαθέο ζπνπδέο ζε επίπεδν M.Sc. ζε ζέκαηα Μεηεσξνινγίαο θαη Φπζηθήο Πεξηβάιινληνο. Έρεη εξγαζηεί θαηά ην παξειζόλ ζε εξεπλεηηθά πξνγξάκκαηα, ζε ζπλαθή ηνπ E-wave project αληηθείκελα, ζηελ Οκάδα Αηκνζθαηξηθώλ Μνληέισλ θαη Πξόγλσζεο Καηξνύ ηνπ Παλεπηζηεκίνπ Αζελώλ. Έρεη δεκνζηεύζεη αξηζκό άξζξσλ ζε επηζηεκνληθά πεξηνδηθά θαη δηεζλή ζπλέδξηα ζε ζέκαηα Μεηεσξνινγίαο θαη εθαξκνγώλ ελώ έρεη κεγάιε εκπεηξία ζε επηζηεκνληθό πξνγξακκαηηζκό θαη αξηζκεηηθά κνληέια πξνζνκνίσζεο κεηεσξνινγηθώλ δηεξγαζηώλ. Επηζπλάπηεηαη πιήξεο βηνγξαθηθό ζεκείσκα ηνπ Νένπ Μέινπο. 4 ΑΙΣΙΑ ΑΝΣΙΚΑΣΑΣΑΗ Η κεγάιε θαζπζηέξεζε ζηελ θαηαβνιή ηεο δεύηεξεο δόζεο ρξεκαηνδόηεζεο από ην Ίδξπκα Πξνώζεζεο Έξεπλαο (ΙΠΕ) είρε σο ζπλέπεηα λα δεκηνπξγεζεί ηεξάζηην πξόβιεκα ζηε δηαρείξηζε ηνπ έξγνπ θαζώο νη εξεπλεηέο πνπ εξγαδόηαλ ζηελ νκάδα καο γηα ην ζπγθεθξηκέλν έξγν έκεηλαλ ρσξίο ακνηβή γηα εμαηξεηηθά κεγάιν ρξνληθό δηάζηεκα θαη απνρώξεζαλ. Παξ όια απηά ε Οκάδα Αηκνζθαηξηθώλ Μνληέισλ θαη Πξόγλσζεο Καηξνύ ηνπ Παλεπηζηεκίνπ Αζελώλ θαηέβαιε θάζε δπλαηή πξνζπάζεηα γηα ηελ νινθιήξσζε ηνπ έξγνπ πξνρσξώληαο ζηελ πξόζιεςε λέσλ εξεπλεηώλ κε ηζνδύλακα πξνζόληα νη νπνίνη δέρηεθαλ λα εξγαζηνύλ θαη λα πιεξσζνύλ όηαλ ην ΙΠΕ αληαπνθξηζεί ζηνπο όξνπο ρξεκαηνδόηεζεο ηνπ έξγνπ. ηελ πξνθεηκέλε πεξίπησζε ε θ. Καινγεξή δηαζέηεη πεξηζζόηεξα ηππηθά θαη νπζηαζηηθά πξνζόληα από απηά ηνπ πξνθαηόρνπ ηεο θ. Αζαλαζέιιε. ηελ θ. Καινγεξή κεηαθέξνληαη νη 2 αλζξσπνκήλεο πνπ δελ είραλ θαιπθζεί από ηνλ θ. Αζαλαζέιιε βάζεη ηνπ πξνεγνύκελνπ πξνϋπνινγηζκνύ. 5. ΤΛΟΠΟΙΗΗ ΕΡΓΟΤ Οη παξαπάλσ αιιαγέο ζηε θαηαλνκή ησλ δαπαλώλ δελ δεκηνπξγνύλ θαλέλα δηαρεηξηζηηθό πξόβιεκα γηαηί νη εξγαζίεο εθηειέζηεθαλ από ίδηαο θαηεγνξίαο θαη εηδηθόηεηαο πξνζσπηθό ελώ ηα παξαδνηέα νινθιεξώζεθαλ θαλνληθά ζύκθσλα κε ην ρξνλνδηάγξακκα

225 ΚΤΠΡΙΑΚΗ ΔΗΜΟΚΡΑΣΙΑ ΕΤΡΩΠΑΪΚΗ ΕΝΩΗ 6. ΥΟΛΙΑ ΙΠΕ Η ΔΕΜΗ 2008 ΤΓΥΡΗΜΑΣΟΔΟΣΕΙΣΑΙ ΑΠΟ ΣΗΝ ΚΤΠΡΙΑΚΗ ΔΗΜΟΚΡΑΣΙΑ ΚΑΙ ΣΟ ΕΤΡΩΠΑΪΚΟ ΣΑΜΕΙΟ ΠΕΡΙΦΕΡΕΙΑΚΗ ΑΝΑΠΣΤΞΗ ΣΗ ΕΕ Μόνο για σπήζη από ηο ΙΠΕ. Παπακαλώ μη ζςμπληπώνεηε. Απμόδιορ Λειηοςπγόρ ΙΠΕ Ημεπ/νια
226 PANOS ATHANASIADIS University of Athens, School of Physics, Division of Environmental Physics & Meteorology, Atmospheric Modeling and Weather Forecasting Group. University Campus Bldg PHYS 5, Athens, Greece. Tel: , Fax: , EDUCATION Ph.D. in Meteorology, University of Reading, UK, Received distinction at coursework component. Dissertation: Teleconnections and Transient Eddies. Advisors: Dr Maarten Ambaum and Prof. Sir Brian Hoskins. M.Sc. in Environmental Physics, National University of Athens, Greece, Received distinction, first in class. Thesis: An examination of the main dynamic and thermodynamic parameters producing intense convective storms in north Greece. B.Sc. in Physics, National University of Athens, Greece, PUBLICATIONS Ambaum, M. and P. Athanasiadis, The Response of a Uniform Horizontal Temperature Gradient to Heating. Journal of Atmospheric Sciences, p P. Athanasiadis and M. Ambaum, Linear Contributions of Different Time Scales to Teleconnectivity. Journal of Climate, vol. 22, p P. Athanasiadis and M. Ambaum, Do High-Frequency Eddies Contribute to Low-Frequency Teleconnection Tendencies? Journal of Atmospheric Sciences, vol. 67, p P. Athanasiadis and J. M. Wallace, Patterns of Wintertime Jet Stream Variability and their Relation to the Storm Tracks. Journal of Atmospheric Sciences, vol. 67, p To be submitted : Ε. Tyrlis, G. Kallos and P. Athanasiadis. Evaluation of a high-resolution reanalysis for Europe, N. Africa and the N. Atlantic based on the Limited Area Prediction System (LAPS). Bulletin of American Meteorological Society. C. Spyrou, G. Kallos and P. Athanasiadis. A study of the radiative effects of airborne dust using an implementation of the Rapid Radiation Transfer Model (RRTM) to the SKIRONi/iDUST modeling system. Geophysical Research Letters.
227 PARTICIPATION IN CONFERENCES P. Athanasiadis, M. Ambaum and Sir B. Hoskins. Teleconnections and Transient Eddies; Studying their Interaction. American Geophysical Union, Chapman Meeting 2006, Savannah, USA. P. Athanasiadis and M. Ambaum. Extratropical teleconnections analyzed in frequency bands. COMECA, Thessaloniki, 2008, Conference Proceedings, p P. Athanasiadis, J. M. Wallace and Justin Wettstein. Patterns of Wintertime Jet Stream Variability and their Relation to the Storm Tracks. American Geophysical Union, Fall Meeting 2009, San Francisco, USA. P. Athanasiadis and J. M. Wallace. Patterns of Jet Stream Wintertime Variability. COMECAP, Patra, 2010, Conference Proceedings, p EMPLOYMENT 10/2009i ipresenti: Post-doc Research Associate, University of Athens, AM&WFG, Greece. Soon after my return to Greece I Joined the Atmospheric Modeling & Weather Forecasting Group. Worked in the CIRCE project studying the effects of airborne African dust on short- and long-wave radiation fluxes at the surface. Currently, working for the MARINA-PLATFORM project, carrying out a multi-year, high-resolution climate simulation for off-shore renewable-energy applications. 05/2007i 08/2009 : Research Associate, University of Washington / JISAO. Identified patterns of jet-stream variability and examined their relation to storm-track variability and forcing. Analyzed potential vorticity variability near the tropopause and studied extratropical interannual sea surface temperature variability. Employed Q-vectors as a diagnostic for large-scale forcing of vertical motion related to the Asian winter Monsoon. 10/2004i i06/2005i: Teaching Assistant, University of Reading, UK. Constructively assisted with teaching atmospheric physics and statistics to MSc students. Responsibly marked course assignments and proctored the general examinations. GRANTS & SCHOLARSHIPS After exams, received PhD scholarship from the Greek State Scholarships Foundation. Received travel award from the Legacies Fund of Royal Meteorological Society. Also, received a travel grant
228 from the American Geophysical Union to attend the AGU Chapman meeting on Jets and Annular Structures (2006). ACTING AS A REFERREE Served as external examiner for the final examination (20/05/2010) of the Ph.D. candidate Luis Negral at the Department of Chemical and Environmental Engineering, Technical University of Cartagena, Spain. Served as reviewer for the following scientific journals: Journal of Climate (2), Journal of Atmospheric Sciences (1), Advances in Meteorology (1). MEMBER OF SCIENTIFIC UNIONS American Geophysical Union, American Meteorological Society, Royal Meteorological Society. SKILLS Computing: UNIXi/iLINUX, MATLAB, FORTRAN, LaTeX, HTML. Modeling: Have worked with a hierarchy of numerical models: Contour Αdvection Semi-Lagrangian model (simplified circulation model based on PV advection and inversion), GFDL Flexible Modeling System (state-of-the-art climate model), SKIRON-ETA (regional atmospheric model). Communication: Excellent presentation skills; work presented at international conferences. Languages: English and Greek, both fluently (oral and written). REFERENCES Prof. George Kallos University of Athens, Atmospheric Modeling & Weather Forecasting Group. Tel: , Cell: , kallos@mg.uoa.gr Prof. John Mike Wallace University of Washington, Department of Atmospheric Sciences Tel: (206) , wallace@atmos.washington.edu Prof. Sir Brian Hoskins Director of Grantham Institute for Climate Change, Imperial College of London. Tel: +44 (0) , b.j.hoskins@reading.ac.uk / b.hoskins@ic.ac.uk Dr. Maarten Ambaum Department of Meteorology, University of Reading. Tel: +44 (0) , m.h.p.ambaum@reading.ac.uk
229 CURRICULUM VITAE Name: Date and place of birth: Christos Spyrou , Athens Organization of primary employment: University of Athens Department of Physics, Division of Applied Physics Panepistimioupolis, Bldg. PHYS-V Athens, Greece Phone: Title of primary employment: Researcher EDUCATION Ph.D, University of Athens, Department of Physics, 2011 M.Sc, University of Athens, Department of Physics, Environmental Physics, 2004 B.Sc., University of Athens, Department of Physics, 2002 FOREIGN LANGUAGES English (Certificate of Proficiency in English, University of Cambridge, Certificate of Proficiency in English, University of Michigan, 1998) French (Diplôme D`Études Francaises,Sorbonne 2em Degré, 1996) FIELDS OF SCIENTIFIC ACTIVITIES Atmospheric Modeling and Weather Forecasting Air Pollution Modeling (Dispersion, Diffusion) Radiation studies Climate Studies COMPUTER SKILLS Unix Linux Visualization Tools (NCAR,NCL,IDV,GRADS) Programming Languages: FORTRAN, Bash Microsoft Office (Word, EXCEL, PowerPoint, Front Page) PUBLICATIONS IN SCIENTIFIC JOURNALS C. Spyrou, G. Kallos, C. Mitsakou, P. Athanasiadis, C. Kalogeri and M. J. Iacono, 2013: Modeling the radiative effects of desert dust on weather and regional climate. Atmos. Chem. Phys., 13, , doi: /acp , 2013
230 C. Spyrou, C. Mitsakou, G. Kallos, P. Louka, and G. Vlastou, 2010: An improved limited area model for describing the dust cycle in the atmosphere. Journal Of Geophysical Research, 115, D17211, doi: /2009jd013682, M. Astitha, G. Kallos, C. Spyrou, W. O Hirok, J. Lelieveld and H. A. C. Denier van der Gon, 2010: Modelling the chemically aged and mixed aerosols over the eastern central Atlantic Ocean potential impacts. Atm. Chem. Phys., 10, , 2010, doi: /acp G Kallos, C Spyrou, M Astitha, C Mitsakou, S Solomos, J Kushta, I Pytharoulis, P Katsafados, E Mavromatidis, N Papantoniou and G Vlastou, 2009: Ten-year operational dust forecasting - Recent model development and future plans. IOP Conf.Series: Earth and Environmental Science 7 (2009), doi: / /7/1/ Mitsakou C., G. Kallos, N. Papantoniou, C. Spyrou, S. Solomos, M. Astitha and C. Housiadas, 2008: Saharan dust levels in Greece and received inhalation doses. Atm. Chem. Phys., 8, , 2008, doi: /acp G. Kallos, M. Astitha, P. Katsafados and C. Spyrou, 2007: Long-Range Transport of Anthropogenically and Naturally Produced PM in the Mediterranean and North Atlantic: Present Status of Knowledge. Journal of Applied Meteorology and Climatology, 46, , doi: /JAM P. Kishcha, P. Alpert, A. Shtivelman,S. O. Krichak, J. H. Joseph, G. Kallos, P. Katsafados, C. Spyrou, G. P. Gobbi, F. Barnaba, S. Nickovic, C. Perez, and J. M. Baldasano, 2007: Forecast errors in dust vertical distributions over Rome (Italy): Multiple particle size representation and cloud contributions. Journal of Geophysical Research, 112(D15205), doi: /2006JD D.K. Pissimanis, V.A. Notaridou, C.K. Spyrou, 2005: On the main characteristics of the synoptic weather conditions associated with thunderstorm activities in the months of July and August in the city of Thessaloniki (Northern Greece). Theoretical and Applied Climatology doi: /s PUBLICATIONS IN CONFERENCE PROCEEDINGS G. Kallos, S. Solomos, J. Kushta, C. Spyrou, C. Kalogeri, 2012: Natural And Anthropogenic Aerosols in the Mediterranean Region and Middle East: Patterns and Impacts, Air Quality Management at Urban, Regional and Global Scales 4th International Symposium and IUAPPA Regional Conference, September 2012, Istanbul Technical University, Istanbul Turkey. C. Spyrou, G. Kallos, C. Mitsakou, P. Athanasiadis, and C. Kalogeri, 2012: The Effects of Naturally Produced Dust Particles on Radiative Transfer, 11th International Conference on Meteorology, Climatology and Atmospheric Physics (COMECAP), Athens, Greece, 29 May 1 June S. Solomos, J. Kushta, C. Spyrou, C. Mitsakou, G. Kallos, 2010: A Modeling Study On The Effects Of Aerosol On Cloud Processes And Precipitation, 10th International Conference on Meteorology, Climatology and Atmospheric Physics (COMECAP), Patra, Greece, May 2010.
231 G.Kallos, S.Solomos, J.Kushta, C.Spyrou, C.Kalogeri, C.Mitsakou, 2010: Modeling Aerosol-Radiation-Cloud And Precipitation Processes, The 6th Specialty Conference And Exhibition On Environmental Progress In The Petroleum & Petrochemical Industries, Enviro Arabia 2010, April M.Astitha, C.Spyrou, G. Kallos, H.A.C.Denier Van Der Gon and A.J.H.Visschedijk, 2009: Chemical Composition Of Aerosols Along The Long- Range Transport Paths, 30th Nato/Sps International Technical Meeting On Air Pollution Modelling And Its Application, May, 2009, San Francisco, Usa. Kallos G, C. Spyrou, C. Mitsakou, 2009: Short and Long Wave Radiative Forcing from Desert Dust and Impacts on Weather and Climate, European Geosciences Union General Assembly 2009, EGU , Vienna, Austria, April Kallos G., Astitha M., Spyrou C., Solomos S., Kushta J., Mavromatidis E. and Mitsakou C., 2008: Saharan Dust and Anthropogenic Aerosols Regional Characteristics, First International Conference: From Deserts to Monsoons, Aldemar Knossos Royal Village Conference Center,1-6 June 2008, Crete, Greece Mitsakou, C., Kallos, G., Papantoniou, N., Spyrou, C., Solomos, S., Astitha, M., Housiadas, C. Lung dose from mineral Saharan dust to Greek residents, 2008: Society of Environmental Geochemistry and Health 26 th European Conference SEGH 2008, Athens, Greece, 31/3-2/4, Papantoniou, N., Mitsakou, C., Solomos, S., Kousta, I., Mavromatidis, E., Spyrou,C., Astitha, M., Pytharoulis, I., Katsafados, P., Kallos, G., 2008: Modelling in meteorological and climate applications, 1st HellasGrid User Forum, Athens, Greece, January 10-11, G. Kallos, C. Spyrou, M. Astitha, C. Mitsakou, S. Solomos, J. Kushta, I. Pytharoulis, P. Katsafados, E. Mavromatidis, N. Papantoniou, 2007: Ten-year operational dust forecasting Recent model development and future plans. WMO/GEO Expert Meeting on an International Sand and Dust Storm Warning System, Barcelona, Spain, November 7-9, P. Katsafados, G. Kallos, C. Spyrou and A. Papadopoulos, 2007: Geographical distribution of seasonal and annual amounts of Saharan dust deposition over Mediterranean and Europe. 8th Pan-Hellenic Geographical Conference, 4 7 October 2007, Athens, Greece. C. Spyrou, P. Katsafados, M. Astitha, A. Papadopoulos and G. Kallos, 2007: A model to simulate the atmospheric dust cycle: sensitivity tests. 8th Pan-Hellenic Geographical Conference, 4 7 October 2007, Athens, Greece. G. Kallos, M. Astitha, P. Katsafados, C. Spyrou and E. Mavromatidis, 2007: Saharan dust transport and its impact on air quality, ecosystems and regional climate. IUGG 2007 Perugia-XXIV General Assembly, 2-13 June 2007, Perugia, Italy, ISBN G. Kallos, P. Katsafados, M. Astitha, A. Papadopoulos and C. Spyrou, 2005: Saharan dust transport towards the Euro-Mediterranean Region and its implications to air quality, ecosystems and climate. International Association of Meteorology and Atmospheric Sciences (IAMAS) 2005 Scientific Assembly,
232 Beijing, China, August Kallos G., Katsafados P., Spyrou C., Papadopoulos A.: Desert dust deposition over the Mediterranean Sea estimated with the SKIRON/Eta - System validation, 4th EuroGOOS Conference Brest France June WORKSHOPS C. Mitsakou, G. Kallos and C. Spyrou, 2011: Saharan dust levels in Greece: Impacts on urban environment and human health, 6th International Workshop On Sand/Duststorms And Associated Dustfall, 7-9 September 2011, Athens, Greece. C. Spyrou, G. Kallos, C. Mitsakou and C. Kalogeri, 2011: Radiative effects of desert dust on weather and climate, 6th International Workshop On Sand/Duststorms And Associated Dustfall, 7-9 September 2011, Athens, Greece. Kallos, G., Solomos, S., Kushta, I., Spyrou, C., Mavromatidis, E., Astitha, M., Mitsakou, C., 2008: The Integrated Community Limited Area Modeling System ICLAMS, 3rd International Workshop on Mineral Dust, Leipzig, Germany, 15-17/9/2008. POSTER PRESENTATIONS G. Kallos, G. Galanis, S. Sofianos, C. Mitsakou, C. Spyrou, C. Kalogeri, N. Bartsotas, J. Athanaselis, V. Vervatis, S. Solomos, P. Axaopoulos, J.A. Qahtani, D.W. Beard, I. Alexiou, E. Alaa, 2013: An integrated weather and sea state forecasting system for the Arabian Peninsula (WASSF), EGU General Assembly 2013, AS1.1, Vienna, Austria, April, L. Cradden, C. Kalogeri, C. Spyrou, A. Adam, C. Stathopoulos, G. Galanis, S. Sofianos, D. Ingram, G. Kallos, A. Papapostolou, P. Axaopoulos, 2012: A combined resource atlas for marine energy, 4th International Conference on Ocean Energy (ICOE) 2012, Dublin October A. Adam, C. Kalogeri, C. Spyrou, J. Athanaselis, S. Sofianos, G. Galanis and G. Kallos, 2012: Offshore Energy Mapping for Northeast Atlantic and Mediterranean: MARINA PLATFORM project, EGU General Assembly 2012, ERE1.2, Vienna, Austria, April, G. Kallos, G. Galanis, C. Mitsakou, P. Athanasiadis, C. Spyrou, S., Sofianos, and C. Kalogeri, 2011: Energy resource mapping at the framework of MARINA PLATFORM project, EGU General Assembly 2011, OS4.6, Vienna, Austria, 3 8 April, C. Spyrou, C. Mitsakou, P. Athanasiadis, G.Kallos, and C. Kalogeri, 2011: Study of the radiative effects of desert dust on weather and climate, EGU General Assembly 2011, CL1.24/AS4.1, Vienna, Austria, 3 8 April, S.Solomos, G.Kallos, J.Kushta, M.Astitha, C.Spyrou, C.Mitsakou, 2009: A modeling study on the effects of aerosol concentration and chemical composition on precipitation amounts and distribution, International workshop on: Atmospheric Composition Changes: Climate-Chemistry Interactions, Lecce, Italy, November 2-4, 2009.
233 Kallos, G., C. Spyrou, C. Mitsakou, G. Vlastou and C. Kalogeri, 2008: The new surface and radiative transfer parameterization in the SKIRON/Dust modelling System, Eos Trans. AGU, 89(53), Fall Meet. Suppl., Abstract A43A December 2008, San Francisco. Kallos, G., Spyrou, C., Astitha, M., Mitsakou, C., Solomos, S., Kushta, I., Mavromatidis, E., 2008: Recent SKIRON dust model development and future plans, EGU General Assembly 2008, Vienna, Austria, 13-18/4/2008. REVIEWER FOR: Atmospheric Chemistry and Physics Scientific Research and Essays Atmospheric Environment Meteorology and Atmospheric Physics Journal Of Geophysical Research International Journal Of Climatology Environmental and Fluid Mechanics Journal of Aerosol Science TECHNICAL REPORTS G. Kallos, P. Katsafados, C. Spyrou, 2008: The Weather Forecasting System POSEIDON II: Operational Manual And Description Of The Model. University of Athens, Department of Applied Physics, Athens, 2008 G. Kallos, C. Spyrou, N.Papantoniou, C. Mitsakou, M. Astitha, S. Solomos and P. Katsafados, 2007 : Analysis of the Particulate Matter Exceedances in Greece. Period Final Report Prepared for the Ministry of Environment City Planning and Public Work, June G. Kallos, C. Spyrou, S. Solomos, P. Katsafados and M. Astitha, 2006 : Analysis of the Particulate Matter Exceedances in Greece During the Period Technical Report Prepared for the Ministry of Environment City Planning and Public Work, June G. Kallos, P. Katsafados, C. Spyrou, 2006: Evaluation of atmospheric and wave models. Deliverable 3.8 for the project ESPEN (An Enhanced operational System for wave monitoring and Prediction with Applications in Hellenic Navigation). BOOK CHAPTERS
234 George Kallos, Petros Katsafados and Christos Spyrou: Part II Chapter 5: Desert dust uptake-transport and deposition mechanisms impacts of dust on radiation, clouds and precipitation of Gualtieri C. and D.T. Mihailovic, (eds.) 2012: Fluid Mechanics of Environmental Interfaces, Second Edition. Taylor & Francis Ltd (ISBN ), pp.107. Development Of Algorithms For The Calculation Of The Feedback Of Naturally Produced Particles Of Radiative Transfer And Energy Balance, 2011, University of Athens, PhD dissertation. Available at: George Kallos, Christina Mitsakou, Andres Alastuey, John van Ardenne, Marina Astitha, Michael Cusack, Ulrike Doering, Evangelos Gerasopoulos, Nikolaos Hatzianastassiou, Maria Kanakidou, Jonilda Kushta, Jos Lelieveld, Zev Levin, Nikolaos Mihalopoulos, Millán Millán, Josè L. Palau, N. Perez, Jorge Pey, Xavier Querol, Stavros Solomos, Christos Spyrou, Chris Theodosi, Christos Zerefos: Part I - Chapter 3: Mechanisms of climate variability, air quality and impacts of atmospheric constituents in the Mediterranean Region, Regional Assessment Climate Change in the Mediterranean (RACCM) report, PROJECT PARTICIPATION MFSTEP (Mediterranean Forecasting System Toward Environmental) POW WOW (Prediction Of Waves, Wakes and Offshore Wind) ΥΠΕΧΩΔΕ INSEA (Data Integration System for Eutrophication Assessment in Coastal Waters) ESPEN (An Enhanced operational System for wave monitoring and Prediction with Applications in Hellenic Navigation) CIRCE (Climate Change and Impact Research the Mediterranean Environment) MARINA (MArine Renewable INtegrated Application Platform)
235 Christina Kalogeri Date of Birth: Place of Birth: Athens, Greece ORGANIZATION OF PRIMARY EMPLOYMENT University of Athens Department of Physics, Division of Applied Physics Panepistimioupolis, Bldg. PHYS-V Athens, Greece Phone: Web: PROFESSIONAL EXPERIENCE 2008 Present: PhD Researcher, Atmospheric Modeling and Weather Forecasting Group EDUCATION PhD Candidate, University of Athens, Environmental Physics, Meteorology Title: Modeling the lower atmosphere and the sea surface with applications to renewable energy issues MSc., University of Athens, Environmental Physics, Meteorology, 2010 BSc., University of Athens, Physics, 2008 FIELDS OF SCIENTIFIC INTERESTS - ACTIVITIES Atmospheric Modeling and Weather Forecasting Air Pollution Modeling Wave Modeling and Marine Meteorology High Resolution Wave and Wind Energy Resource Assessment Statistical modeling for atmospheric and wave Parameters Extreme values and uncertainty estimation
236 PUBLICATIONS Christina Kalogeri, Alexandros Adam, George Galanis and George Kallos, Evaluation of high resolution wave simulations by means of SAR-observations and estimation of the wave power spatial and temporal distribution, European Space Agency (ESA), SEASAR Galanis G., Zodiatis G., Hayes D., Nikolaidis A., Georgiou G., Stylianou S., Kallos G., Kalogeri C., Chu P.C., Charalambous A., Savvidou K., Michaelides S. : Numerical wave modeling and wave energy estimation, 11th International Conference on Meteorology, Climatology and Atmospheric Physics, COMECAP 2012, Athens, Greece, 30 May 1 June Spyrou C., Kallos G., Mitsakou C., Athanasiadis P. & Kalogeri C.,2012: The Effects of Naturally Produced Particles on Radiative Transfer, 11th International Conference on Meteorology, Climatology and Atmospheric Physics, COMECAP 2012, Athens, Greece, 30 May 1 June George Kallos, Stavros Solomos, Christina Kalogeri, Christina Mitsakou, Christos Spyrou: Dust production by density currents A not so well known source of aerosol particles in the atmosphere, ITM 2012, May 7 11, Netherlands. G. Kallos, G. Galanis, C. Spyrou, C. Kalogeri, A. Adam, and P. Athanasiadis, 2012: Offshore Energy Mapping for Northeast Atlantic and Mediterranean: MARINA PLATFORM project, EGU General Assembly 2012, Vienna, Austria, April Galanis G., Zodiatis G., Hayes D., Nikolaidis A., Georgiou G., Stylianou S., Kallos G., Kalogeri C., Chu P.C., Charalampous A., Savidou K. and Michaelides S.: The E-wave project: Estimation of wave power potential in Cyprus, 10thPanHellenic Symposium of Oceanography and Fishery, Athens G. Galanis, G. Zodiatis, D. Hayes, A. Nikolaidis, C. Kalogeri, A. Adam, G. Kallos and G. Georgiou, 2012: Near Shore Wave modeling and applications to wave energy estimation, EGU General Assembly 2012, Vienna, Austria, April C. Spyrou, G. Kallos, C. Mitsakou and C. Kalogeri, 2011: Radiative effects of desert dust on weather and climate, 6th International Workshop On Sand/Duststorms And Associated Dustfall, 7-9 September 2011, Athens, Greece. Kallos G., P. J. Athanasiadis, G. Galanis, C. Mitsakou, S. Sofianos, G. A. Athanassoulis, C. Spyrou, and C. Kalogeri 2011: Energy resource mapping in the framework of the MARINA PLATFORM project, EGU General Assembly 2011, Vienna, Austria, 3-8 April, C. Spyrou, C. Mitsakou, P. Athanasiadis, G.Kallos, and C. Kalogeri, 2011: Study of the radiative effects of desert dust on weather and climate, EGU General Assembly 2011, Vienna, Austria, 3-8 April, G.Kallos, S.Solomos, J.Kushta, C.Spyrou, C.Kalogeri, C.Mitsakou, 2010: Modeling Aerosol- Radiation-Cloud And Precipitation Processes, The 6th Specialty Conference And Exhibition On Environmental Progress In The Petroleum & Petrochemical Industries, Environ Arabia 2010, April Kallos, G., C. Spyrou, C. Mitsakou, G. Vlastou and C. Kalogeri, 2008: The new surface and radiative transfer parameterization in the SKIRON/Dust modelling System, Eos Trans. AGU, 89(53), Fall Meet. Suppl., Abstract A43A December, San Francisco.
237 PARTICIPATION IN FUNDED PROJECTS ANEMOS.plus. A European Specific Targeted Research Project Funded by EU (FP6). Priority 6.1-Sustainable Energy Systems. WASSF. Development of a Weather Analysis and Sea State Forecast system for Saudi Arabia, funded by Saudi Aramco. MARINA Platform. Marine Renewable Integrated Application Platform, funded by EU (FP7). CIMME. Climate Change and Impacts in the Eastern Mediterranean and Middle East, funded by The Cyprus Institute, RESEARCH GRANTS The Cyprus Institute, Research fellowship Cyprus Wind Atlas, TECHNICAL KNOWLEDGE Operating Systems: Unix-Linux, Windows Programming: Fortran, Shell scripting, HTML Parallel Computing: MPICH2, OpenMPI Atmospheric Models: SKIRON, RAMS Wave Models: WAM, SWAN Data Visualization Programs: NCL, REVU, MATLAB Data Handling: HDF, GRIB, NETCDF
238
239
240
241 Wave Energy Potential in the Eastern Mediterranean Levantine Basin. An integrated 10-year study George Zodiatis a, George Galanis a,b, Christina Kalogeri c, Andreas Nikolaidis a, Dan Hayes a, Georgios C. Georgiou a, Peter C. Chu d, and George Kallos c a Oceanography Centre, University of Cyprus, Nicosia 1678, Cyprus b Hellenic Naval Academy, Section of Mathematics, Xatzikiriakion, Piraeus 18539, Greece c University of Athens, Department of Physics, Atmospheric Modeling and Weather Forecasting Group, University Campus, Bldg. PHYS-V, Athens 15784, Greece d Naval Postgraduate School, Graduate School of Engineering & Applied Science, Department of Oceanography, Monterey, CA 93943, USA. Abstract The main characteristics of wave energy potential over Eastern Mediterranean Levantine Basin, an area with increased interest in energy resources exploration/exploitation, is presented in this work. In particular, an integrated hindcasting platform consisting of state of the art wind-wave numerical models at a very high resolution mode is utilized to produce a 10-year data base for the wave energy potential in the Levantine Basin and the environmental parameters that affect it. The numerical results are analyzed by means of a variety of statistical measures focusing, apart from the conventional statistical information, on the potential impact of extreme values and the probability distribution functions that optimally describe the spatial and temporal distribution of the wave power values over the Eastern Mediterranean Sea area. The regions with increased values of wave energy potential are mainly the western and southern coastlines of Cyprus island, the sea area of Lebanon and Israel, as well as the coastline of Egypt especially around Alexandria. Over these areas, a relatively low but also stable and hence exploitable wave energy potential is revealed. However, non-trivial impact of infrequent values is also recorded. Key-words: Wave Energy, Numerical atmospheric and wave modeling 1
242 1. Introduction The exploitation of renewable energy resources is nowadays a key issue worldwide under the warnings of the scientific community for global warming, ocean acidification, the open questions relevant to climate change mitigation and adaptation, the shadow of recent economic crisis that directly affected the oil-dependent energy sources, as well as the concerns raised for the security and robustness to natural disasters of nuclear power infrastructures. Within this framework a great number of actions have been taken for supporting new technologies and develop novel scientific methodologies in order to support clean forms of energy, with the wind and solar approaches keeping the primary roles in Europe and the U.S. Lately, action is taken, especially in European countries, for another renewable source, the wave energy, that is the energy that can be produced by sea waves. There are some critical advantages in this alternative form of energy, the most crucial of which is the low variability, especially when compared with the wind energy, which allows the easier adaptation to large power grids. However, there is a serious distance that remains to be covered before wave energy science and technology reach the maturity level of its wind and photovoltaic counterparts. This maturity level must be reached before wave power production can be a commercially viable resource. The discussion on converting the energy of sea waves to power goes back to 19 th century or even earlier (Leishman & Scobie, 1976). In the 1940 s Yoshio Masuda was testing wave-energy devices (Masuda, 1985). However, a more active development began only after the rapid increase of the prices of oil-dependent fuels in 1970 s (Clement et al., 2002). The research efforts in the field gained the support of the European Commission the last two decades and a number of national and international projects have been carried out focusing on different regions by different points of view and using a variety of technical tools and configurations. Denfe et al. (2009) studied the wave energy potential along the southeast Atlantic coast of the United States based on the measurements of buoy stations in the area. Falnes (2007) focused on wave-energy converters and wave spectrum parameters related to the distribution of wave energy. Pontes (1998), presented a European Wave Energy Atlas based on annual and seasonal wave statistics derived from a coarse grid wave 2
243 modeling simulations. Henfridson et al. (2007) investigated different possible wave power installations in the Baltic and North Seas. Arinaga and Cheung (2012) published a 10-year hindcast study based on the WaveWatch3 wave model. Iglesias et al. (2009a, 2009b, 2010) studied the wave energy distribution over different areas of Spain (Death Coast, Galicia and Bares) based on hindcast simulated data and buoy measurements while Henfridson et al. (2007) focused on the area of Baltic and North Sea by examining cases of possible wave power installations. In this work, we present a systematic study of the wave energy potential and the relevant sea parameters in the Levantine Basin, Eastern Mediterranean. In particular, an integrated very high resolution atmospheric/wave modeling system was developed for simulating the atmospheric circulation and the sea waves evolution in the area over a period of ten years ( ). The system was operated in a hindcasting mode taking advantage of all available atmospheric and wave observations in the area under study: satellite records, meteorological station observations and ship reports have been assimilated in the simulation procedure providing, in this way, a complete representation of the environmental parameters and resulting to detailed wave climatology of the area. This fact in conjunction with the very high horizontal resolution (~ 0.01 degrees) and the long temporal horizon adopted, although very expensive in CPU time, makes this study the most detailed approach for the Eastern Mediterranean Sea, an area with increased political and commercial interest in the field of energy resources exploration/exploitation. Moreover, an extended statistical analysis of the results is presented including not only the classical statistical information for the sea and energy parameters usually obtained, but also measures for the asymmetry of the results and the impact of extreme values, information that could be critical for site assessment. On the other hand, probability distribution functions are proposed for the complete description of the main parameters that affect the wave energy potential, that is, the significant wave height and the energy period, but also the wave energy itself. The paper has been organized as follows: In Section 2 the numerical wind and wave models, the data sets and the methodology adopted for estimating the wave energy related parameters are 3
244 described. Section 3 contains the main information and results obtained while the conclusions reached are summarized in Section Models and methodology A number of state of the art numerical models for the simulation of the main atmospheric and wave parameters that are needed for the detailed monitoring of the wave energy have been utilized in the present work in conjunction with available observations in the area of interest and a variety of statistical approaches targeting to a high quality analysis of the obtained results. Wave modeling. The main issue for a wave energy study is the simulation or monitoring of the significant wave height H s and wave period T e that directly affect the wave energy potential (Pontes, 1998): 2 g 2 P HsTe (1) 64 where ρ denotes the water density and g the gravity acceleration. Towards this direction, the wave model WAM (WAMDIG, 1988; Komen et al., 1994; Bidlot et al., 2003) was used. WAM is a third generation wave model which solves the wave transport equation explicitly without any presumptions on the shape of the wave spectrum. It represents the physics of the wave evolution in accordance with our current knowledge and uses the full set of degrees of freedom of a 2d wave spectrum. In our case, the ECMWF version, CY33R1 (Jansen, 2000, 2004) has been utilized. This new version contains a number of important updates that increase significantly the potential capabilities of the wave system: A new advection scheme, based on the Corner Transport Upstream scheme, is used by the introduction of contributions from the corner points (Bidlot et al. 2007), a new parameterization of shallow water effects is introduced that affects both the time evolution of the wave spectrum and the determination of the kurtosis of the wave field (Janssen and Onorato, 2007). In addition, two extreme wave parameters have been introduced, namely the average maximum wave height and the corresponding wave period (Mori and Janssen, 2006). The same 4
245 version of the WAM model employed for the present work, is also used by the CYCOFOS-Cyprus coastal ocean forecasting system (Zodiatis et al., 2008) providing operational 3-hourly wave forecasts for 4 and half days on a daily basis, at a resolution of 10 km and 5 km respectively in the Mediterranean Sea and the Levantine Basin ( The wave model domain covers the eastern part of the Mediterranean Sea: 30N 41N, 15E 37E (Figure 1) in order to capture all the necessary swell information that affects the region of Levantine: 30.0 N-38.0 N, 27.5 E 36.5 E (red rectangle in Fig. 1) which is the main area of interest. On the other hand, a very high spatial resolution has been adopted (1/60 x 1/60 degrees). To the author s knowledge, this resolution is the highest used by research or operational models running presently for this area. In this way, the local characteristics are taken into account in a more credible and detailed way in contrast to previous local wave energy studies in which much coarser grids were used. For example, Pontes (1998) used a 0.5x0.5 degrees resolution for the Mediterranean Sea. Arinaga and Cheung (2012) employed the WaveWatch3 model with a 1.25x1 degree resolution. The wave spectrum was discretized to 25 frequencies (range Hz logarithmically spaced) and 24 directions (equally spaced) while the propagation time step has been set to 45 seconds in order to meet the CFL stability criterion s standards resulting to a system highly demanding in computational power. The main characteristics of the wave model employed are summarized in Table 1. WAM was operated on a shallow water mode, driven by 3-hourly wind input (10 m wind speed and direction) obtained from the SKIRON regional atmospheric system (Kallos, 1997; Papadopoulos et al., 2001). The horizontal resolution used for the SKIRON model coincides with that of the wave model while 45 vertical levels stretching from surface to 20 Km altitude are employed. The atmospheric system uses NCEP/GFS 0.5x0.5 degrees resolution fields for initial and boundary conditions. The necessary sea surface boundary conditions are interpolated from the 0.5x0.5 degrees SST (Sea Surface Temperature) field analysis retrieved from NCEP on a daily basis. Vegetation and topography data are applied at a resolution of 30 seconds and soil texture data with resolution of 120 seconds. It is important to underline that any available observations in the area under study obtained by meteorological stations for the atmospheric model and satellite records for wave parameters have been assimilated into the atmospheric and wave models respectively based on the standard assimilation schemes of SKIRON and WAM models (see Chu et al. 2004; Emmanouil et al. 2007; Galanis et al., 2009; Janssen et al., 1987; Kalnay 2002; Lionello et al., 1992; Rao et al., 1997), leading in this way, to a fully integrated hindcasting system. 5
246 Wave model WAM, ECMWF version CY33R1 Area covered 30N 41N, 15E 37E Horizontal Resolution 1/60 x 1/60 degrees (1.852 km x km approximately) Frequencies 25 (range Hz logarithmically spaced) Directions 24 (equally spaced) Timestep 45 sec Wind forcing SKIRON atmospheric model Wind forcing time step 3 hours Table 1. Summary of the wave model characteristics. The main output of the wave model is the 2-d wave spectrum where stands for frequencies, for directions, over all latitudes and longitudes of the domain used. The necessary parameters for our study are obtained as integrated byproducts computed based on the moments of the spectrum:, n = -1, 0, 1, 2 (2) More precisely, the significant wave height and the energy period are given by (3) Statisital analysis/measures. It is one of the main targets in the present work to provide a detailed statistical analysis of the obtained wave-energy information by utilizing statistical measures that provide qualitative information with potential added value for energy applications. Towards this direction, the following statistical indices and measures are estimated: The mean value: N 1 xi (), (4) N i 1 where x denotes the parameter in study (significant wave height, mean wave period or wave energy) and N the size of the sample; 6
247 The standard deviation: N 1 N xi () 2, (5) i 1 which is a typical variation index; The skewness: g 1 N N i xi () 3 (6) a measure of the asymmetry of the probability distribution, and the kurtosis: g 1 N N i xi () 4 3 (7) which measures the "peakedness" of the probability distribution and the impact of possible extreme values. On the other hand, the estimated power data were approached by a distribution fitting point of view as discussed in detail in Section Results and Analysis The 10year ( ) wave energy resource monitoring for the Levantine Basin in the Eastern Mediterranean is provided by the high resolution hindcast data produced by the wave model WAM that was configured to simulate the wave conditions of the entire Eastern Mediterranean sea with a resolution of 1 arc minute (about 1.8 km by 1.5 km). In order to depict the main wave climatological characteristics of the area, an analysis in different time scales was performed. Decadal, interannual and monthly characteristics of the main parameters concerning this study were analyzed. A detailed yearly presentation of all the statistical parameters utilized for the wave energy potential and the main wave parameters that affect it (significant wave height and mean wave period) is provided in the Supplement. 7
248 Levantine s coastal areas are characterized in general by low wave energy potential with 10 year mean of about 2 KW/m. An area of increased interest is the western coastline of Cyprus island that experiences the highest mean values (2.5 KW/m) in contrast to the northern, southern and eastern coastal sea areas of the island where the 10year mean power values are lower than 1 KW/m (Figure 2). This can be attributed to their exposure to the synoptic scale forcing resulting in prevailing winds from the western sector (Kallos and Metaxas., 1980) which, in conjunction with the long fetch, characterizes the western coasts of Cyprus as a swell dominated area with a mean decadal wave period of approximately 5 sec (Figure 3). A second region worth noticing is the coastal areas of Lebanon and Israel as well as the sea area of Alexandria in Egypt which have comparable available energy potential values to the western coasts of Cyprus with similar behavior regarding the statistical analysis. The wave energy potential during the 10 year period of study in this area is mostly concentrated in values lower than the mean (positive skew) with a relatively high standard deviation of ~ 5 KW/m and a high positive kurtosis (about 10) revealing an intense influence from infrequent deviations (Figure 2). The relatively stable behavior of the mean and standard deviation values of wave energy (Figures S.1, S.2) along with the elevated decadal and annual standard deviation values reveals increased monthly variability partly attributed to the seasonality of wave energy as depicted in three representative years (Supplement ). More precisely for the period May-September a stable behavior with more frequent moderate deviations of wave energy potential is indicated. On the other hand, during the winter months (December-March) increased mean values of wave power are associated with high variability (Figures 6, 7, 12). April and November could be characterized as transient months. Moreover, kurtosis seems to vary significantly in an annual and monthly basis taking rather high decadal, annual, monthly values greater than 6 indicating a significant influence by extreme values (Figure 2, 7). The high spatial variability of kurtosis in comparison with the rest of statistical measures is also a critical characteristic of the area underlying the importance of high resolution modeling in site selection (Figure 7). 8
249 The wave period is the most stable component of the energy equation with a behavior close to a normal distribution as seen by the small values of the main asymmetry measures under study (skeweness and kurtosis values less than 1, Figure 3). On the other hand, wave height seems to vary significantly inside the study period experiencing relatively high, compared to the mean value, standard deviation (Figure 8). The stable interannual behavior of the mean significant wave height along with monthly variability through the years reveals a type of seasonality similar to that of wave energy (Figures S.5, S.6). Relatively low decadal kurtosis (~3, Figure 8) along with small annual values (0.5 to 3, Figure S.8) and significant monthly variations denote that the impact of extreme values has a seasonal character too. In general, the wave energy potential is primarily affected by the deviation of the significant wave height, a fact which is in accordance with the 2nd order relation with it, and secondary by the energy period which has a stable behavior due to the local wave climatology. Some statistics for a number of hot spots (Figure 11) in a power potential point of view are particularly presented in Figures The available power over these areas along the coastlines of Cyprus, Lebanon and Egypt, is even five times more than the average reaching 10kW/m during the winter months. Special emphasis should be given to the area of Eratosthenes Sea mountain which outperforms all other sites in a power potential point of view having at the same time critical advantages: is an offshore area with low bathymetry and near to the area of the EEZ of Cyprus where significant activity is taken recently for the exploitation of natural gas resources. The estimated power data were, further, fitted to a number of probability density functions (pdfs) in order to define the statistical distribution that describes them in the optimum way. In this way the full package of the statistical information for the data under study are provided. More precisely, the following pdfs where employed: Logistic, Normal, Gamma, Log-Gamma, Log-Logistic, Lognormal, Weibull, Generalized Logistic while different statistical fitted tests were used: Kolmogorov-Smirnov, Anderson-Darling (D'Agostino and Stephens., 1986). The obtained results indicate a clear prevalence of the lognormal distribution: 9
250 ( ), (8) where the parameters μ and σ are defined by the mean value m and the variance v: ( ) ( ) (9) for the cold period October-March. On the other hand, the Generalized Extreme Values (GEV) distribution: ( ) ( ) (10) where the μ is the location parameter, σ the scale and k the shape parameter, prevails during the warm months April September. It is not the first case where the lognormal distribution seems to describe well parameters in geosciences and biology - see, e.g. (Huxley, 1932) for applications in biology and Ritzema (1994) for problems in hydrology but, to the authors knowledge, such an application to wave energy potential is something new. On the other hand, the GEV distribution seems to describe well here the complete data set of wave power values and not merely the corresponding extremes. It is important to underline that the parameters of the optimal distribution for each case vary in space providing important information for the wave energy potential. In Figures 9 10 this spatial variation is illustrated. Based on the above results, potential end users are able to consider the appropriate version of probability density function that fits to the wave data parameters and to energy potential at the point or area of interest obtaining, in this way, accurate information on the wave energy mean value, variance, uncertainty and the corresponding possible extreme values. The western coastline of Cyprus as the area with increased mean values of wave energy is reconfirmed here. However, nontrivial values are revealed for the variation indices. 5. Conclusions The wave energy potential spatial and temporal distribution over the Eastern Mediterranean Sea is the subject of this work. Two state of the art numerical models for the simulation of the atmospheric and sea state parameters over the area of interest have been used over a time period of 10 years ( ) at a very high spatial resolution (1/60 degrees) which, to the authors knowledge, is the finest adopted for the area until now. Available observational data by satellites and meteorological 10
251 stations have been assimilated into the models leading to an integrated hindcasting system. The obtained results have been analyzed based on a variety of statistical measures monitoring their expected values, variation, asymmetry and potential impact of extreme/non-frequent values while probability density functions have been also employed for the description of wave power leading to the following main outcomes: The most energetic offshore areas of the Levantine basin, in a wave energy potential point of view, are the western coastline of Cyprus, the sea area around Israel and Lebanon and the coastline of Alexandria in Egypt, characterized by low 10 years mean wave energy potential of about 2.5 KW/m. For these areas there is a generally stable yearly behavior of wave power values which, however, are exposed to increased non-frequent values impact as the elevated positive kurtosis indicate. The significant spatial variability of kurtosis values is a critical characteristic of the area revealing the importance of high resolution studies for site selection. The wave energy potential modeled values are well described by the 2-parameter lognormal distribution during the period October-March while the Generalized Extreme Values distribution fits closely to the data during April September. However, a non-negligible spatial distribution of the corresponding scale and shape parameters is revealed. Wave height values over the area have a non-trivial decadal variation with increased - normalized by the mean value - kurtosis and standard deviation. The wave period, on the other hand, appears much more stable and normally distributed. The area of Eratosthenes sea mountain seems to be a point of exceptional interest with increased power potential even 500% more than the average of the Levantine basin having at the same time critical geographical advantages. Acknowledgements The present work is supported by the E-WAVE project funded by the Research Promotion Foundation of the Republic of Cyprus and the European Regional Development Fund. 11
252 References. Arinaga R., Cheung K.F. (2012), Atlas of global wave energy from 10 years of reanalysis and hindcast data, Renewable Energy 39, Bidlot J, Janssen P, Abdalla S, Hersbach H (2007) A revised formulation of ocean wave dissipation and its model impact. ECMWF Tech. Memo ECMWF, Reading, United Kingdom, 27pp. available online at: Clement A., McCullen P., Falcao A., Fiorentino A., Gardner F., Hammarlund K., Lemonis G., Lewis T., Nielsen K., Petroncini S., Pontes M.T., Schild P., Sjostrom B.O., Sorensen H.C., Thorpe T. (2002), Wave Energy in Europe: current status and perspectives, Renewable and Sustainable Energy Reviews 6, Chu PC, Qi Y, Chen YC, Shi P, Mao QW (2004), South China Sea wave characteristics. Part-1: Validation of wavewatch-iii using TOPEX/Poseidon data, Journal of Atmospheric and Oceanic Technology, 21 (11), D'Agostino RB, Stephens MA (1986), Goodness-of-fit Techniques, New York: Marcel Dekker. Defne Z., Haas K., Fritz H. (2009), Wave energy potential along the Atlantic coast of the southeastern USA, Renewable Energy 34, Emmanouil G, Galanis G, Kallos G, Breivik LA, Heilberg H, Reistad M (2007), Assimilation of radar altimeter data in numerical wave models: An impact study in two different wave climate regions, Annales Geophysicae 25 (3), Falnes J., A review of wave-energy extraction, Marine Structures 20 (2007), Galanis G, Emmanouil G, Kallos G, Chu PC (2009), A new methodology for the extension of the impact in sea wave assimilation systems, Ocean Dynamics, 59 (3), Henfridsson, U, Neimane V, Strand K, Kapper R, Bernhoff H, Danielsson O, Leijon M, Sundberg J, Thorburn K, Ericsson K, Bergman K (2007), Wave Energy Potential in the Baltic Sea and the Danish Part of the North Sea, with Reflections on the Skagerrak, Renewable Energy, Vol 32, pp Huxley JS. (1932), Problems of relative growth. New York: Dial Press. 12
253 Iglesias G., Carballo, R. (2009), Wave energy resource along the Death Coat (Spain), Renewable Energy 34, Iglesias G., Lopez M., Carballo, R., Castro A., Fraguela J.A., Frigaard P. (2009), Wave energy potential in Galicia (NW Spain), Renewable Energy 34, Iglesias G., Carballo, R. (2010), Wave energy resource in the Estaca de Bares area (Spain), Renewable Energy 35, Janssen P, Lionello P, Reistad M, Hollingsworth A (1987) A study of the feasibility of using sea and wind information from the ERS-1 satellite, part 2: Use of scatterometer and altimeter data in wave modelling and assimilation. ECMWF report to ESA, Reading. Janssen P (2000), ECMWF wave modeling and satellite altimeter wave data. In D. Halpern (Ed.), Satellites, Oceanography and Society, pp , Elsevier. Janssen P (2004), The Interaction of Ocean Waves and Wind. Cambridge, University Press, 300pp. Janssen, P.A.E.M., and M. Onorato (2007), The Intermediate Water Depth Limit of the Zakharov Equation and Consequences for Wave Prediction. J. Phys. Oceanogr. 37, Kallos G and Metaxas D (1980), Synoptic processes for the formation of Cyprus lows. Rivista di Meteorologia Aeronautica. XL 2-3, pp Kallos G (1997), The Regional weather forecasting system SKIRON. Proceedings, Symposium on Regional Weather Prediction on Parallel Computer Environments, October 1997, Athens, Greece, 9 pp. Kalnay E (2002), Atmospheric Modeling, Data Assimilation and Predictability. Cambridge University Press, 341. Komen G, Cavaleri L, Donelan M, Hasselmann K, Hasselmann S, Janssen P (1994) Dynamics and Modelling of ocean waves, Cambridge University Press. Leishman JM, Scobie G. (1976), The development of wave power a techno economical study, Dept. of the industry, NEL Report, EAU M25. Lionello P, Günther H, Janssen P (1992) Assimilation of altimeter data in a global third generation wave model, Journal of Geophysical Research, 97 (C9),
254 Masuda Y, An experience of wave power generator though tests and improvement. In: Evans DV, Falcao AFO, editors (1985). Hydrodynamics of ocean wave energy utilization-iutam symposium Lisbon/Portugal. Berlin: Heidelberg:Springer-Verlag; 1986, Mori N. and P.A.E.M. Janssen (2006), On kurtosis and occurrence probability of freak waves. J. Phys. Oceanogr. 36, Papadopoulos A, Katsafados P, Kallos G (2001), Regional weather forecasting for marine application. Global Atmos. Ocean Syst., 8, No 2-3, Pontes M.T. (1998), Assessing the European Wave Energy Resource, Transactions of the American Meteorological Society, Vol. 120, Rao ST, Zurbenko IG, Neagu R, Porter PS, Ku JY, Henry RF (1997) Space and Time Scales in Ambient Ozone Data, Bull. Amer. Meteor. Soc., 78 (10), Ritzema, H.P. and T.P. Tuong. (1994), Water-management strategies as a tool for the sustainable use of acid sulphate soils. Regional Workshop on the sustainable Use of Coastal Land in South-east Asia, April 1994, Asian Institute of Technology, Bangkok, 34 p. WAMDIG, The WAM-Development and Implementation Group: Hasselmann S, Hasselmann K, Bauer E, Bertotti L, Cardone CV, Ewing JA, Greenwood JA, Guillaume A, Janssen P, Komen G, Lionello P, Reistad M, Zambresky L (1988) The WAM Model - a third generation ocean wave prediction model, Journal of Physical Oceanography, 18 (12), Zodiatis G., D. R. Hayes, R. Lardner, G. Georgiou (2008), Sub-regional forecasting and observing system in the Eastern Mediterranean Levantine Basin: the Cyprus Coastal Ocean Forecasting and Observing System (CYCOFOS), CIESM Monographs no. 34 (F. Briand Editor), ISSN ,
255 Figure 1: Wave model domains Figure 2: Main statistical parameters regarding the available wave energy potential (Kw/m) for the Eastern Mediterranean. The 10year a) mean b) Standard deviation c) Skewness d) Kurtosis values. Figure 3: Main statistical parameters regarding the energy wave period (sec) for the Eastern Mediterranean. The 10year a) mean b) Standard deviation c) Skewness d) Kurtosis values. Figure 4: The yearly evolution of the mean wave energy potential for the western coasts of Cyprus. Figure 5: The yearly evolution of the Standard Deviation of wave energy potential for the western coasts of Cyprus. Figure 6: Mean monthly values of wave energy potential for the year Figure 7: Kurtosis monthly values of wave energy potential for the year 2005 Figure 8: Main statistical parameters regarding the significant wave height (m) for the Eastern Mediterranean. The 10year a) mean b) Standard deviation c) Skewness d) Kurtosis values. Figure 9: The spatial distribution of the Lognormal pdf parameters during the period October March Figure 10: The spatial distribution of the GEV pdf parameters during the period April September 2009 (a) k parameter (b) m parameter (c) sigma parameter Figure 11: Hot-spots in a power potential point of view in the Levantine Basin Figure 12: Mean monthly wave power potential (KW/m) for the period over different areas of the Levantine Figure 13: Monthly standard deviation of the wave power potential (KW/m) for the period over different areas of the Levantine Figure 14: Yearly mean wave power potential for the area of Eratosthenes Sea mountain Figure 15: Yearly mean wave power potential for the area of Paphos
256 Figure 1: Wave model domains
257 Figure 2: Main statistical parameters regarding the available wave energy potential (Kw/m) for the Eastern Mediterranean. The 10year a) mean b) Standard deviation c) Skewness d) Kurtosis values.

258 Figure 3: Main statistical parameters regarding the energy wave period (sec) for the Eastern Mediterranean. The 10year a) mean b) Standard deviation c) Skewness d) Kurtosis values.
259 Figure 4: The yearly evolution of the mean wave energy potential for the western coasts of Cyprus.
260 Figure 5: The yearly evolution of the Standard Deviation of wave energy potential for the western coasts of Cyprus.

261 Figure 6: Mean monthly values of wave energy potential for the year 2005.

262 Figure 7: Kurtosis monthly values of wave energy potential for the year 2005
263 Figure 8: Main statistical parameters regarding the significant wave height (m) for the Eastern Mediterranean. The 10year a) mean b) Standard deviation c) Skewness d) Kurtosis values.
264 Figure 9: The spatial distribution of the Lognormal pdf parameters during the period October March


 sigma")
265 Figure 10: The spatial distribution of the GEV pdf parameters during the period April September 2009 (a) k parameter (b) m parameter (c) sigma parameter

266 Figure 11: Hot-spots in a power potential point of view in the Levantine Basin
267 Figure 12: Mean monthly wave power potential (KW/m) for the period over different areas of the Levantine
268 Figure 13: Monthly standard deviation of the wave power potential (KW/m) for the period over different areas of the Levantine
269 Figure 14: Yearly mean wave power potential for the area of Eratosthenes Sea mountain
270 Figure 15: Yearly mean wave power potential for the area of Paphos
271 SUPPPLEMENT This supplement contains the results obtained within the framework of the present study for the wave power potential in the sea area of Cyprus as well as the significant wave height and mean wave period, which are the main wave parameters that affect it, analyzed by means of the following statistical indexes: Mean value, Standard deviation, Skeweness and Kurtosis.
272 Figure S.1

273 Figure S.2
274 Figure S.3
275 Figure S.4

276 Figure S.5
277 Figure S.6

278 Figure S.7
279 Figure S.8

280 Figure S.9
ΝEWSLETTER 3 ΓΙΑ ΤΟ ΕΡΓΟ Ε WAVE
 ΚΥΠΡΙΑΚΗ ΔΗΜΟΚΡΑΤΙΑ ΕΥΡΩΠΑΪΚΗ ΕΝΩΣΗ Η ΔΕΣΜΗ 2009 2010 ΣΥΓΧΡΗΜΑΤΟΔΟΤΕΙΤΑΙ ΑΠΟ ΤΗΝ ΚΥΠΡΙΑΚΗ ΔΗΜΟΚΡΑΤΙΑ ΚΑΙ ΤΟ ΕΥΡΩΠΑΪΚΟ ΤΑΜΕΙΟ ΠΕΡΙΦΕΡΕΙΑΚΗΣ ΑΝΑΠΤΥΞΗΣ ΤΗΣ ΕΕ ΝEWSLETTER 3 ΓΙΑ ΤΟ ΕΡΓΟ Ε WAVE To έργο E WAVΕ
1) Abstract (To be organized as: background, aim, workpackages, expected results) (300 words max) Το όριο λέξεων θα είναι ελαστικό.
 Abstract (To be organized as: background, aim, workpackages, expected results) (300 words max) Το όριο λέξεων θα είναι ελαστικό.") UΓενικές Επισημάνσεις 1. Παρακάτω θα βρείτε απαντήσεις του Υπουργείου, σχετικά με τη συμπλήρωση της ηλεκτρονικής φόρμας. Διευκρινίζεται ότι στα περισσότερα θέματα οι απαντήσεις ήταν προφορικές (τηλεφωνικά),
UΓενικές Επισημάνσεις 1. Παρακάτω θα βρείτε απαντήσεις του Υπουργείου, σχετικά με τη συμπλήρωση της ηλεκτρονικής φόρμας. Διευκρινίζεται ότι στα περισσότερα θέματα οι απαντήσεις ήταν προφορικές (τηλεφωνικά),
GREECE BULGARIA 6 th JOINT MONITORING
 GREECE BULGARIA 6 th JOINT MONITORING COMMITTEE BANSKO 26-5-2015 «GREECE BULGARIA» Timeline 02 Future actions of the new GR-BG 20 Programme June 2015: Re - submission of the modified d Programme according
ΔΘΝΗΚΖ ΥΟΛΖ ΓΖΜΟΗΑ ΓΗΟΗΚΖΖ
 Ε ΔΘΝΗΚΖ ΥΟΛΖ ΓΖΜΟΗΑ ΓΗΟΗΚΖΖ Κ ΔΚΠΑΗΓΔΤΣΗΚΖ ΔΗΡΑ ΣΜΖΜΑ : Σνπξηζηηθήο Οηθνλνκίαο θαη Αλάπηπμεο (ΣΟΑ) ΣΔΛΗΚΖ ΔΡΓΑΗΑ Θέκα: Σνπξηζκφο θαη Οηθνλνκηθή Κξίζε Δπηβιέπσλ : Νηνχβαο Λνπθάο πνπδάζηξηα : Σζαγθαξάθε
GREECE BULGARIA 6 th JOINT MONITORING
 GREECE BULGARIA 6 th JOINT MONITORING COMMITTEE BANSKO 26-5-2015 LEGISLATIVE FRAMEWORK Regulation 1083/2006 (general provisions for ERDF). Regulation 1080/2006 (ERDF) Regulation 1028/2006 (Implementing
ΣΥΓΧΡΟΝΕΣ ΤΑΣΕΙΣ ΣΤΗΝ ΕΚΤΙΜΗΣΗ ΚΑΙ ΧΑΡΤΟΓΡΑΦΗΣΗ ΤΩΝ ΚΙΝΔΥΝΩΝ
 ΕΘΝΙΚΗ ΣΧΟΛΗ ΤΟΠΙΚΗΣ ΑΥΤΟΔΙΟΙΚΗΣΗΣ Δ ΕΚΠΑΙΔΕΥΤΙΚΗ ΣΕΙΡΑ ΤΜΗΜΑ ΠΟΛΙΤΙΚΗΣ ΠΡΟΣΤΑΣΙΑΣ ΣΥΓΧΡΟΝΕΣ ΤΑΣΕΙΣ ΣΤΗΝ ΕΚΤΙΜΗΣΗ ΚΑΙ ΧΑΡΤΟΓΡΑΦΗΣΗ ΤΩΝ ΚΙΝΔΥΝΩΝ Σπουδάστρια: Διαούρτη Ειρήνη Δήμητρα Επιβλέπων καθηγητής:
ΤΕΙ ΚΑΒΑΛΑΣ ΣΧΟΛΗ ΤΕΧΝΟΛΟΓΙΚΩΝ ΕΦΑΡΜΟΓΩΝ ΤΜΗΜΑ ΗΛΕΚΤΡΟΛΟΓΙΑΣ ΠΤΥΧΙΑΚΗ ΕΡΓΑΣΙΑ
 ΤΕΙ ΚΑΒΑΛΑΣ ΣΧΟΛΗ ΤΕΧΝΟΛΟΓΙΚΩΝ ΕΦΑΡΜΟΓΩΝ ΤΜΗΜΑ ΗΛΕΚΤΡΟΛΟΓΙΑΣ ΠΤΥΧΙΑΚΗ ΕΡΓΑΣΙΑ ΜΕΛΕΤΗ ΦΩΤΟΒΟΛΤΑΙΚΟΥ ΠΑΡΚΟΥ ΜΕ ΟΙΚΙΣΚΟΥΣ ΓΙΑ ΠΑΡΑΓΩΓΗ ΗΛΕΚΤΡΙΚΗΣ ΕΝΕΡΓΕΙΑΣ ΜΕΣΗΣ ΤΑΣΗΣ STUDY PHOTOVOLTAIC PARK WITH SUBSTATIONS
ΠΑΝΔΠΗΣΖΜΗΟ ΠΑΣΡΩΝ ΣΜΖΜΑ ΖΛΔΚΣΡΟΛΟΓΩΝ ΜΖΥΑΝΗΚΩΝ ΚΑΗ ΣΔΥΝΟΛΟΓΗΑ ΤΠΟΛΟΓΗΣΩΝ ΣΟΜΔΑ ΤΣΖΜΑΣΩΝ ΖΛΔΚΣΡΗΚΖ ΔΝΔΡΓΔΗΑ
 ΠΑΝΔΠΗΣΖΜΗΟ ΠΑΣΡΩΝ ΣΜΖΜΑ ΖΛΔΚΣΡΟΛΟΓΩΝ ΜΖΥΑΝΗΚΩΝ ΚΑΗ ΣΔΥΝΟΛΟΓΗΑ ΤΠΟΛΟΓΗΣΩΝ ΣΟΜΔΑ ΤΣΖΜΑΣΩΝ ΖΛΔΚΣΡΗΚΖ ΔΝΔΡΓΔΗΑ Γηπισκαηηθή Δξγαζία ηνπ Φνηηεηή ηνπ ηκήκαηνο Ζιεθηξνιόγσλ Μεραληθώλ θαη Σερλνινγίαο Ζιεθηξνληθώλ
«ΑΓΡΟΤΟΥΡΙΣΜΟΣ ΚΑΙ ΤΟΠΙΚΗ ΑΝΑΠΤΥΞΗ: Ο ΡΟΛΟΣ ΤΩΝ ΝΕΩΝ ΤΕΧΝΟΛΟΓΙΩΝ ΣΤΗΝ ΠΡΟΩΘΗΣΗ ΤΩΝ ΓΥΝΑΙΚΕΙΩΝ ΣΥΝΕΤΑΙΡΙΣΜΩΝ»
 I ΑΡΙΣΤΟΤΕΛΕΙΟ ΠΑΝΕΠΙΣΤΗΜΙΟ ΘΕΣΣΑΛΟΝΙΚΗΣ ΣΧΟΛΗ ΝΟΜΙΚΩΝ ΟΙΚΟΝΟΜΙΚΩΝ ΚΑΙ ΠΟΛΙΤΙΚΩΝ ΕΠΙΣΤΗΜΩΝ ΤΜΗΜΑ ΟΙΚΟΝΟΜΙΚΩΝ ΕΠΙΣΤΗΜΩΝ ΠΡΟΓΡΑΜΜΑ ΜΕΤΑΠΤΥΧΙΑΚΩΝ ΣΠΟΥΔΩΝ ΣΤΗΝ «ΔΙΟΙΚΗΣΗ ΚΑΙ ΟΙΚΟΝΟΜΙΑ» ΚΑΤΕΥΘΥΝΣΗ: ΟΙΚΟΝΟΜΙΚΗ
ΤΕΧΝΟΛΟΓΙΚΟ ΕΚΠΑΙ ΕΥΤΙΚΟ Ι ΡΥΜΑ ΚΡΗΤΗΣ ΣΧΟΛΗ ΙΟΙΚΗΣΗΣ ΚΑΙ ΟΙΚΟΝΟΜΙΑΣ ΤΜΗΜΑ ΙΟΙΚΗΣΗΣ ΕΠΙΧΕΙΡΗΣΕΩΝ ΠΤΥΧΙΑΚΗ ΕΡΓΑΣΙΑ
 ΤΕΧΝΟΛΟΓΙΚΟ ΕΚΠΑΙ ΕΥΤΙΚΟ Ι ΡΥΜΑ ΚΡΗΤΗΣ ΣΧΟΛΗ ΙΟΙΚΗΣΗΣ ΚΑΙ ΟΙΚΟΝΟΜΙΑΣ ΤΜΗΜΑ ΙΟΙΚΗΣΗΣ ΕΠΙΧΕΙΡΗΣΕΩΝ ΠΤΥΧΙΑΚΗ ΕΡΓΑΣΙΑ Το franchising ( δικαιόχρηση ) ως µέθοδος ανάπτυξης των επιχειρήσεων λιανικού εµπορίου
ΕΘΝΙΚΟ ΜΕΤΣΟΒΙΟ ΠΟΛΥΤΕΧΝΕΙΟ ΣΧΟΛΗ ΗΛΕΚΤΡΟΛΟΓΩΝ ΜΗΧΑΝΙΚΩΝ ΚΑΙ ΜΗΧΑΝΙΚΩΝ ΥΠΟΛΟΓΙΣΤΩΝ ΤΟΜΕΑΣ ΗΛΕΚΤΡΙΚΗΣ ΙΣΧΥΟΣ
 ΕΘΝΙΚΟ ΜΕΤΣΟΒΙΟ ΠΟΛΥΤΕΧΝΕΙΟ ΣΧΟΛΗ ΗΛΕΚΤΡΟΛΟΓΩΝ ΜΗΧΑΝΙΚΩΝ ΚΑΙ ΜΗΧΑΝΙΚΩΝ ΥΠΟΛΟΓΙΣΤΩΝ ΤΟΜΕΑΣ ΗΛΕΚΤΡΙΚΗΣ ΙΣΧΥΟΣ Προοπτικές Εναρμόνισης της Ελληνικής Αγοράς Ηλεκτρικής Ενέργειας με τις Προδιαγραφές του Μοντέλου
Μεταπτυχιακή διατριβή. Ανδρέας Παπαευσταθίου
 Σχολή Γεωτεχνικών Επιστημών και Διαχείρισης Περιβάλλοντος Μεταπτυχιακή διατριβή Κτίρια σχεδόν μηδενικής ενεργειακής κατανάλωσης :Αξιολόγηση συστημάτων θέρμανσης -ψύξης και ΑΠΕ σε οικιστικά κτίρια στην
Πανεπιστήμιο Πειραιώς Τμήμα Πληροφορικής Πρόγραμμα Μεταπτυχιακών Σπουδών «Πληροφορική»
 Πανεπιστήμιο Πειραιώς Τμήμα Πληροφορικής Πρόγραμμα Μεταπτυχιακών Σπουδών «Πληροφορική» Μεταπτυχιακή Διατριβή Τίτλος Διατριβής Επίκαιρα Θέματα Ηλεκτρονικής Διακυβέρνησης Ονοματεπώνυμο Φοιτητή Σταμάτιος
Section 8.3 Trigonometric Equations
 99 Section 8. Trigonometric Equations Objective 1: Solve Equations Involving One Trigonometric Function. In this section and the next, we will exple how to solving equations involving trigonometric functions.
ΟΙΚΟΝΟΜΟΤΕΧΝΙΚΗ ΑΝΑΛΥΣΗ ΕΝΟΣ ΕΝΕΡΓΕΙΑΚΑ ΑΥΤΟΝΟΜΟΥ ΝΗΣΙΟΥ ΜΕ Α.Π.Ε
 Τμήμα Ηλεκτρονικών Μηχανικών Τ.Ε. ΟΙΚΟΝΟΜΟΤΕΧΝΙΚΗ ΑΝΑΛΥΣΗ ΕΝΟΣ ΕΝΕΡΓΕΙΑΚΑ ΑΥΤΟΝΟΜΟΥ ΝΗΣΙΟΥ ΜΕ Α.Π.Ε Πτυχιακή Εργασία Φοιτητής: Γεμενής Κωνσταντίνος ΑΜ: 30931 Επιβλέπων Καθηγητής Κοκκόσης Απόστολος Λέκτορας
«ΑΝΑΠΣΤΞΖ ΓΠ ΚΑΗ ΥΩΡΗΚΖ ΑΝΑΛΤΖ ΜΔΣΔΩΡΟΛΟΓΗΚΩΝ ΓΔΓΟΜΔΝΩΝ ΣΟΝ ΔΛΛΑΓΗΚΟ ΥΩΡΟ»
 ΓΔΩΠΟΝΗΚΟ ΠΑΝΔΠΗΣΖΜΗΟ ΑΘΖΝΩΝ ΣΜΗΜΑ ΑΞΙΟΠΟΙΗΗ ΦΤΙΚΩΝ ΠΟΡΩΝ & ΓΕΩΡΓΙΚΗ ΜΗΥΑΝΙΚΗ ΣΟΜΕΑ ΕΔΑΦΟΛΟΓΙΑ ΚΑΙ ΓΕΩΡΓΙΚΗ ΥΗΜΕΙΑ ΕΙΔΙΚΕΤΗ: ΕΦΑΡΜΟΓΕ ΣΗ ΓΕΩΠΛΗΡΟΦΟΡΙΚΗ ΣΟΤ ΦΤΙΚΟΤ ΠΟΡΟΤ «ΑΝΑΠΣΤΞΖ ΓΠ ΚΑΗ ΥΩΡΗΚΖ ΑΝΑΛΤΖ ΜΔΣΔΩΡΟΛΟΓΗΚΩΝ
ΑΙΤΗΣΗ APPLICATION FORM FOR GREEK APPLICANTS. 1. Τίτλος Κοινού Ερευνητικού Σχεδίου:... Title of joint project:...
 ΕΛΛΗΝΙΚΗ ΔΗΜΟΚΡΑΤΙΑ ΥΠΟΥΡΓΕΙΟ ΠΑΙΔΕΙΑΣ, ΕΡΕΥΝΑΣ ΚΑΙ ΘΡΗΣΚΕΥΜΑΤΩΝ ------ ΙΔΡΥΜΑ ΚΡΑΤΙΚΩΝ ΥΠΟΤΡΟΦΙΩΝ (Ι.Κ.Υ.) ΔΙΕΥΘΥΝΣΗ ΕΙΔΙΚΩΝ ΠΡΟΓΡΑΜΜΑΤΩΝ ΔΙΕΘΝΩΝ ΥΠΟΤΡΟΦΙΩΝ, ΤΜΗΜΑ ΥΠΟΤΡΟΦΙΩΝ ΑΛΛΟΔΑΠΩΝ ΚΑΙ ΜΟΡΦΩΤΙΚΩΝ
Study of urban housing development projects: The general planning of Alexandria City
 Paper published at Alexandria Engineering Journal, vol, No, July, Study of urban housing development projects: The general planning of Alexandria City Hisham El Shimy Architecture Department, Faculty of
ΤΕΧΝΟΛΟΓΙΚΟ ΠΑΝΕΠΙΣΤΗΜΙΟ ΚΥΠΡΟΥ ΣΧΟΛΗ ΓΕΩΤΕΧΝΙΚΩΝ ΕΠΙΣΤΗΜΩΝ ΚΑΙ ΔΙΑΧΕΙΡΙΣΗΣ ΠΕΡΙΒΑΛΛΟΝΤΟΣ. Πτυχιακή εργασία
 ΤΕΧΝΟΛΟΓΙΚΟ ΠΑΝΕΠΙΣΤΗΜΙΟ ΚΥΠΡΟΥ ΣΧΟΛΗ ΓΕΩΤΕΧΝΙΚΩΝ ΕΠΙΣΤΗΜΩΝ ΚΑΙ ΔΙΑΧΕΙΡΙΣΗΣ ΠΕΡΙΒΑΛΛΟΝΤΟΣ Πτυχιακή εργασία ΑΝΑΛΥΣΗ ΚΟΣΤΟΥΣ-ΟΦΕΛΟΥΣ ΓΙΑ ΤΗ ΔΙΕΙΣΔΥΣΗ ΤΩΝ ΑΝΑΝΕΩΣΙΜΩΝ ΠΗΓΩΝ ΕΝΕΡΓΕΙΑΣ ΣΤΗΝ ΚΥΠΡΟ ΜΕΧΡΙ ΤΟ 2030
ICTR 2017 Congress evaluation A. General assessment
 ICTR 2017 Congress evaluation A. General assessment -1- B. Content - 2 - - 3 - - 4 - - 5 - C. Speakers/ Presentations/ Sessions - 6 - - 7 - D. Posters/ Poster sessions E. Organisation and coordination
Development and operation of University-Industry Liaison Offices in the Republic of Cyprus: Creating the future Dr Gregory Makrides, Director of
 Development and operation of University-Industry Liaison Offices in the Republic of Cyprus: Creating the future Dr Gregory Makrides, Director of Research and IR, University of Cyprus 2BEConnected Project
AΡΙΣΤΟΤΕΛΕΙΟ ΠΑΝΕΠΙΣΤΗΜΙΟ ΘΕΣΣΑΛΟΝΙΚΗΣ ΠΟΛΥΤΕΧΝΙΚΗ ΣΧΟΛΗ ΤΜΗΜΑ ΠΟΛΙΤΙΚΩΝ ΜΗΧΑΝΙΚΩΝ
 AΡΙΣΤΟΤΕΛΕΙΟ ΠΑΝΕΠΙΣΤΗΜΙΟ ΘΕΣΣΑΛΟΝΙΚΗΣ ΠΟΛΥΤΕΧΝΙΚΗ ΣΧΟΛΗ ΤΜΗΜΑ ΠΟΛΙΤΙΚΩΝ ΜΗΧΑΝΙΚΩΝ ΠΡΟΓΡΑΜΜΑ ΜΕΤΑΠΤΥΧΙΑΚΩΝ ΣΠΟΥΔΩΝ ΕΙΔΙΚΕΥΣΗΣ ΠΡΟΣΤΑΣΙΑ ΠΕΡΙΒΑΛΛΟΝΤΟΣ ΚΑΙ ΒΙΩΣΙΜΗ ΑΝΑΠΤΥΞΗ ΔΙΕΡΕΥΝΗΣΗ ΤΩΝ ΠΙΕΣΕΩΝ ΣΤΟ ΠΕΡΙΒΑΛΛΟΝ
2nd Training Workshop of scientists- practitioners in the juvenile judicial system Volos, EVALUATION REPORT
 2nd Training Workshop of scientists- practitioners in the juvenile judicial system Volos, 26-6-2016 Can anyone hear me? The participation of juveniles in juvenile justice. EVALUATION REPORT 80 professionals
ΕΘΝΙΚΗ ΣΧΟΛΗ ΔΗΜΟΣΙΑΣ ΔΙΟΙΚΗΣΗΣ ΙΓ' ΕΚΠΑΙΔΕΥΤΙΚΗ ΣΕΙΡΑ
 ΕΘΝΙΚΗ ΣΧΟΛΗ ΔΗΜΟΣΙΑΣ ΔΙΟΙΚΗΣΗΣ ΙΓ' ΕΚΠΑΙΔΕΥΤΙΚΗ ΣΕΙΡΑ ΤΜΗΜΑ ΤΟΠΙΚΗΣ ΑΥΤΟΔΙΟΙΚΗΣΗΣ ΚΑΙ ΠΕΡΙΦΕΡΕΙΑΚΗΣ ΑΝΑΠΤΥΞΗΣ ΤΕΛΙΚΗ ΕΡΓΑΣΙΑ: ΠΕΡΙΒΑΛΛΟΝ ΚΑΙ ΑΝΑΠΤΥΞΗ: ΠΡΟΣΕΓΓΙΣΗ ΜΕΣΩ ΔΕΙΚΤΩΝ Επιβλέπων: Αθ.Δελαπάσχος
ΓΕΩΠΟΝΙΚΟ ΠΑΝΕΠΙΣΤΗΜΙΟ ΑΘΗΝΩΝ ΤΜΗΜΑ ΕΠΙΣΤΗΜΗΣ ΤΡΟΦΙΜΩΝ ΚΑΙ ΔΙΑΤΡΟΦΗΣ ΤΟΥ ΑΝΘΡΩΠΟΥ
 ΓΕΩΠΟΝΙΚΟ ΠΑΝΕΠΙΣΤΗΜΙΟ ΑΘΗΝΩΝ ΤΜΗΜΑ ΕΠΙΣΤΗΜΗΣ ΤΡΟΦΙΜΩΝ ΚΑΙ ΔΙΑΤΡΟΦΗΣ ΤΟΥ ΑΝΘΡΩΠΟΥ Πρόγραμμα Μεταπτυχιακών Σπουδών «Επιστήμη και Τεχνολογία Τροφίμων και Διατροφή του Ανθρώπου» Κατεύθυνση: «Διατροφή, Δημόσια
ΔΙΑΜΟΡΦΩΣΗ ΣΧΟΛΙΚΩΝ ΧΩΡΩΝ: ΒΑΖΟΥΜΕ ΤΟ ΠΡΑΣΙΝΟ ΣΤΗ ΖΩΗ ΜΑΣ!
 ΔΙΑΜΟΡΦΩΣΗ ΣΧΟΛΙΚΩΝ ΧΩΡΩΝ: ΒΑΖΟΥΜΕ ΤΟ ΠΡΑΣΙΝΟ ΣΤΗ ΖΩΗ ΜΑΣ! ΘΥΜΑΡΑ Μ. Μ. 11 Ο Γυμνάσιο Πειραιά, Δ/νση Β/Θμιας Εκπ/σης Πειραιά e-mail: margthym@yahoo.gr ΠΕΡΙΛΗΨΗ Το πρόγραμμα της διαμόρφωσης των σχολικών
Μαρούσι, 23/9/2010. Προς: ΤΑ ΙΔΡΥΜΑΤΑ ΤΟΥ ΤΕΧΝΟΛΟΓΙΚΟΥ ΤΟΜΕΑ ΤΗΣ ΑΝΩΤΑΤΗΣ ΕΚΠΑΙΔΕΥΣΗΣ ΤΗΣ ΧΩΡΑΣ
 ΕΛΛΗΝΙΚΗ ΔΗΜΟΚΡΑΤΙΑ ΥΠΟΥΡΓΕΙΟ ΠΑΙΔΕΙΑΣ ΔΙΑ ΒΙΟΥ ΜΑΘΗΣΗΣ ΚΑΙ ΘΡΗΣΚΕΥΜΑΤΩΝ ΓΡΑΦΕΙΟ ΥΦΥΠΟΥΡΓΟΥ ΙΩΑΝΝΗ ΠΑΝΑΡΕΤΟΥ Μαρούσι, 23/9/2010 Προς: ΤΑ ΙΔΡΥΜΑΤΑ ΤΟΥ ΤΕΧΝΟΛΟΓΙΚΟΥ ΤΟΜΕΑ ΤΗΣ ΑΝΩΤΑΤΗΣ ΕΚΠΑΙΔΕΥΣΗΣ ΤΗΣ ΧΩΡΑΣ
Assalamu `alaikum wr. wb.
 LUMP SUM Assalamu `alaikum wr. wb. LUMP SUM Wassalamu alaikum wr. wb. Assalamu `alaikum wr. wb. LUMP SUM Wassalamu alaikum wr. wb. LUMP SUM Lump sum lump sum lump sum. lump sum fixed price lump sum lump
Μελέτη των μεταβολών των χρήσεων γης στο Ζαγόρι Ιωαννίνων 0
 Μελέτη των μεταβολών των χρήσεων γης στο Ζαγόρι Ιωαννίνων 0 ΕΘΝΙΚΟ ΜΕΤΣΟΒΙΟ ΠΟΛΥΤΕΧΝΕΙΟ ΔΙΕΠΙΣΤΗΜΟΝΙΚΟ - ΔΙΑΤΜΗΜΑΤΙΚΟ ΠΡΟΓΡΑΜΜΑ ΜΕΤΑΠΤΥΧΙΑΚΩΝ ΣΠΟΥΔΩΝ (Δ.Π.Μ.Σ.) "ΠΕΡΙΒΑΛΛΟΝ ΚΑΙ ΑΝΑΠΤΥΞΗ" 2 η ΚΑΤΕΥΘΥΝΣΗ
Τμήμα Πολιτικών και Δομικών Έργων
 Τμήμα Πολιτικών και Δομικών Έργων Πτυχιακή Εργασία: Τοπογραφικό διάγραμμα σε ηλεκτρονική μορφή κεντρικού λιμένα Κέρκυρας και κτιρίου νέου επιβατικού σταθμού σε τρισδιάστατη μορφή και σχεδίαση με AutoCAD
ΚΛΙΜΑΤΟΛΟΓΙΑ CLIMATOLOGY
 10 ο COMECAP 2010, Πρακτικά Συνεδρίου, Πάτρα 10 th COMECAP 2010, Proceedings, Patras, Greece ΚΛΙΜΑΤΟΛΟΓΙΑ CLIMATOLOGY ΥΧΡΟΥΡΟΝΗΚΖ ΓΗΑΚΤΜΑΝΖ ΣΧΝ ΖΛΔΚΣΡΗΚΧΝ ΔΚΚΔΝΧΔΧΝ ΣΖΝ ΔΛΛΑΓΑ ΓΗΑ ΣΖΝ ΥΡΟΝΗΚΖ ΠΔΡΗΟΓΟ 1998-2007
ΕΘΝΙΚΗ ΣΧΟΛΗ ΔΗΜΟΣΙΑΣ ΔΙΟΙΚΗΣΗΣ ΤΜΗΜΑ ΤΟΠΙΚΗΣ ΑΥΤΟΔΙΟΙΚΗΣΗΣ & ΠΕΡΙΦΕΡΕΙΑΚΗΣ ΑΝΑΠΤΥΞΗΣ. Θέμα: «Ο Προσανατολισμός του Περιφερειακού Σκέλους του Γ ΚΠΣ»
 ΕΘΝΙΚΗ ΣΧΟΛΗ ΔΗΜΟΣΙΑΣ ΔΙΟΙΚΗΣΗΣ ΙΓ ΕΚΠΑΙΔΕΥΤΙΚΗ ΣΕΙΡΑ ΤΜΗΜΑ ΤΟΠΙΚΗΣ ΑΥΤΟΔΙΟΙΚΗΣΗΣ & ΠΕΡΙΦΕΡΕΙΑΚΗΣ ΑΝΑΠΤΥΞΗΣ Θέμα: «Ο Προσανατολισμός του Περιφερειακού Σκέλους του Γ ΚΠΣ» Διπλωματική Εργασία Επιβλέπων:
Κάθε γνήσιο αντίγραφο φέρει υπογραφή του συγγραφέα. / Each genuine copy is signed by the author.
 Κάθε γνήσιο αντίγραφο φέρει υπογραφή του συγγραφέα. / Each genuine copy is signed by the author. 2012, Γεράσιμος Χρ. Σιάσος / Gerasimos Siasos, All rights reserved. Στοιχεία επικοινωνίας συγγραφέα / Author
ΜΕΤΑΠΤΥΧΙΑΚΗ ΔΙΠΛΩΜΑΤΙΚΗ ΕΡΓΑΣΙΑ «ΘΕΜΑ»
 ΠΑΝΕΠΙΣΤΗΜΙΟ ΑΙΓΑΙΟΥ ΣΧΟΛΗ ΑΝΘΡΩΠΙΣΤΙΚΩΝ ΕΠΙΣΤΗΜΩΝ ΤΜΗΜΑ ΕΠΙΣΤΗΜΩΝ ΤΗΣ ΠΡΟΣΧΟΛΙΚΗΣ ΑΓΩΓΗΣ ΚΑΙ ΤΟΥ ΕΚΠΑΙΔΕΥΤΙΚΟΥ ΣΧΕΔΙΑΣΜΟΥ Π.Μ.Σ. «ΠΕΡΙΒΑΛΛΟΝΤΙΚΗ ΕΚΠΑΙΔΕΥΣΗ» ΜΕΤΑΠΤΥΧΙΑΚΗ ΔΙΠΛΩΜΑΤΙΚΗ ΕΡΓΑΣΙΑ «ΘΕΜΑ» «Εφαρμογή
HOMEWORK 4 = G. In order to plot the stress versus the stretch we define a normalized stretch:
 HOMEWORK 4 Problem a For the fast loading case, we want to derive the relationship between P zz and λ z. We know that the nominal stress is expressed as: P zz = ψ λ z where λ z = λ λ z. Therefore, applying
ΠΑΝΕΠΙΣΤΗΜΙΟ ΠΕΙΡΑΙΑ ΤΜΗΜΑ ΝΑΥΤΙΛΙΑΚΩΝ ΣΠΟΥΔΩΝ ΠΡΟΓΡΑΜΜΑ ΜΕΤΑΠΤΥΧΙΑΚΩΝ ΣΠΟΥΔΩΝ ΣΤΗΝ ΝΑΥΤΙΛΙΑ
 ΠΑΝΕΠΙΣΤΗΜΙΟ ΠΕΙΡΑΙΑ ΤΜΗΜΑ ΝΑΥΤΙΛΙΑΚΩΝ ΣΠΟΥΔΩΝ ΠΡΟΓΡΑΜΜΑ ΜΕΤΑΠΤΥΧΙΑΚΩΝ ΣΠΟΥΔΩΝ ΣΤΗΝ ΝΑΥΤΙΛΙΑ ΝΟΜΙΚΟ ΚΑΙ ΘΕΣΜΙΚΟ ΦΟΡΟΛΟΓΙΚΟ ΠΛΑΙΣΙΟ ΚΤΗΣΗΣ ΚΑΙ ΕΚΜΕΤΑΛΛΕΥΣΗΣ ΠΛΟΙΟΥ ΔΙΠΛΩΜΑΤΙΚΗ ΕΡΓΑΣΙΑ που υποβλήθηκε στο
Το μελλοντικό Ευρωπαϊκό Ενεργειακό σύστημα: Υλοποίηση των ενεργειακών στόχων για το 2030
 DEPARTMENT OF ELECTRICAL ENGINEERING, COMPUTER ENGINEERING AND INFORMATICS Το μελλοντικό Ευρωπαϊκό Ενεργειακό σύστημα: Υλοποίηση των ενεργειακών στόχων για το 2030 Dr. Andreas Poullikkas Chair and Associate
ΠΤΥΧΙΑΚΗ ΕΡΓΑΣΙΑ ΕΠΙΧΕΙΡΗΣΕΙΣ ΕΝ ΟΨΕΙ ΤΟΥ ΝΕΟΥ ΟΙΚΟΝΟΜΙΚΟΥ ΠΕΡΙΒΑΛΛΟΝΤΟΣ» Σπουδαστές Μαραβελάκης Γρηγόριος Α.Μ. 3553 Μαυρομήτρος Δημήτριος Α.Μ.
 ΤΕΧΝΟΛΟΓΙΚΟ ΕΚΠΑΙΔΕΥΤΙΚΟ ΙΔΡΥΜΑ ΚΡΗΤΗΣ ΣΧΟΛΗ ΔΙΟΙΚΗΣΗΣ ΚΑΙ ΟΙΚΟΝΟΜΙΑΣ ΤΜΗΜΑ ΔΙΟΙΚΗΣΗΣ ΕΠΙΧΕΙΡΗΣΕΩΝ ΠΤΥΧΙΑΚΗ ΕΡΓΑΣΙΑ «ΤΕΧΝΙΚΕΣ ΑΝΑΠΤΥΞΗΣ ΝΕΩΝ ΠΡΟΙΟΝΤΩΝ ΑΠΟ ΕΠΙΧΕΙΡΗΣΕΙΣ ΕΝ ΟΨΕΙ ΤΟΥ ΝΕΟΥ ΟΙΚΟΝΟΜΙΚΟΥ ΠΕΡΙΒΑΛΛΟΝΤΟΣ»
ΔΘΝΗΚΖ ΥΟΛΖ ΓΖΜΟΗΑ ΓΗΟΗΚΖΖ ΚΑ ΔΚΠΑΙΓΔΤΣΙΚΗ ΔΙΡΑ ΣΔΛΗΚΖ ΔΡΓΑΗΑ
 Δ ΔΘΝΗΚΖ ΥΟΛΖ ΓΖΜΟΗΑ ΓΗΟΗΚΖΖ ΚΑ ΔΚΠΑΙΓΔΤΣΙΚΗ ΔΙΡΑ ΣΜΖΜΑ ΓΔΝΗΚΖ ΓΗΟΗΚΖΖ ΣΔΛΗΚΖ ΔΡΓΑΗΑ Θέκα: «Ζ εθαξκνγή εξγαιείσλ Γηνίθεζεο Οιηθήο Πνηφηεηαο ζην Γεκφζην θαη Ηδησηηθφ ηνκέα: Ζ πεξίπησζε ηνπ Κνηλνχ Πιαηζίνπ
CHAPTER 25 SOLVING EQUATIONS BY ITERATIVE METHODS
 CHAPTER 5 SOLVING EQUATIONS BY ITERATIVE METHODS EXERCISE 104 Page 8 1. Find the positive root of the equation x + 3x 5 = 0, correct to 3 significant figures, using the method of bisection. Let f(x) =
Από την ιδέα στο έργο
 Από την ιδέα στο έργο Δρ. Κωνσταντίνος Νίκας Μεταδιδακτορικός Ερευνητής CSLab: Computing Systems Laboratory 4 ΜΕΛΗ ΔΕΠ 30 χρόνια προσφοράς, από το 1986 5 ΜΕΤΑΔΙΔΑΚΤΟΡΙΚΟΙ ΕΡΕΥΝΗΤΕΣ 17 ΥΠΟΨΗΦΙΟΙ ΔΙΔΑΚΤΟΡΕΣ
ΠΑΝΕΠΙΣΤΗΜΙΟ ΠΑΤΡΩΝ ΤΜΗΜΑ ΗΛΕΚΤΡΟΛΟΓΩΝ ΜΗΧΑΝΙΚΩΝ ΚΑΙ ΤΕΧΝΟΛΟΓΙΑΣ ΥΠΟΛΟΓΙΣΤΩΝ ΤΟΜΕΑΣ ΣΥΣΤΗΜΑΤΩΝ ΗΛΕΚΤΡΙΚΗΣ ΕΝΕΡΓΕΙΑΣ
 ΠΑΝΕΠΙΣΤΗΜΙΟ ΠΑΤΡΩΝ ΤΜΗΜΑ ΗΛΕΚΤΡΟΛΟΓΩΝ ΜΗΧΑΝΙΚΩΝ ΚΑΙ ΤΕΧΝΟΛΟΓΙΑΣ ΥΠΟΛΟΓΙΣΤΩΝ ΤΟΜΕΑΣ ΣΥΣΤΗΜΑΤΩΝ ΗΛΕΚΤΡΙΚΗΣ ΕΝΕΡΓΕΙΑΣ Διπλωματική Εργασία του φοιτητή του τμήματος Ηλεκτρολόγων Μηχανικών και Τεχνολογίας Ηλεκτρονικών
ΠΟΛΥΤΕΧΝΕΙΟ ΚΡΗΤΗΣ ΣΧΟΛΗ ΜΗΧΑΝΙΚΩΝ ΠΕΡΙΒΑΛΛΟΝΤΟΣ
 ΠΟΛΥΤΕΧΝΕΙΟ ΚΡΗΤΗΣ ΣΧΟΛΗ ΜΗΧΑΝΙΚΩΝ ΠΕΡΙΒΑΛΛΟΝΤΟΣ Τομέας Περιβαλλοντικής Υδραυλικής και Γεωπεριβαλλοντικής Μηχανικής (III) Εργαστήριο Γεωπεριβαλλοντικής Μηχανικής TECHNICAL UNIVERSITY OF CRETE SCHOOL of
ΔΙΑΤΜΗΜΑΤΙΚΟ ΠΡΟΓΡΑΜΜΑ ΜΕΤΑΠΤΥΧΙΑΚΩΝ ΣΠΟΥΔΩΝ ΣΤΗ ΔΙΟΙΚΗΣΗ ΕΠΙΧΕΙΡΗΣΕΩΝ ΘΕΜΕΛΙΩΔΗΣ ΚΛΑΔΙΚΗ ΑΝΑΛΥΣΗ ΤΩΝ ΕΙΣΗΓΜΕΝΩΝ ΕΠΙΧΕΙΡΗΣΕΩΝ ΤΗΣ ΕΛΛΗΝΙΚΗΣ ΑΓΟΡΑΣ
 ΔΙΑΤΜΗΜΑΤΙΚΟ ΠΡΟΓΡΑΜΜΑ ΜΕΤΑΠΤΥΧΙΑΚΩΝ ΣΠΟΥΔΩΝ ΣΤΗ ΔΙΟΙΚΗΣΗ ΕΠΙΧΕΙΡΗΣΕΩΝ Διπλωματική Εργασία ΘΕΜΕΛΙΩΔΗΣ ΚΛΑΔΙΚΗ ΑΝΑΛΥΣΗ ΤΩΝ ΕΙΣΗΓΜΕΝΩΝ ΕΠΙΧΕΙΡΗΣΕΩΝ ΤΗΣ ΕΛΛΗΝΙΚΗΣ ΑΓΟΡΑΣ Του ΚΩΣΤΟΥΛΗ ΔΗΜΗΤΡΙΟΥ ΤΟΥ ΒΑΣΙΛΕΙΟΥ
ΖΩΝΟΠΟΙΗΣΗ ΤΗΣ ΚΑΤΟΛΙΣΘΗΤΙΚΗΣ ΕΠΙΚΙΝΔΥΝΟΤΗΤΑΣ ΣΤΟ ΟΡΟΣ ΠΗΛΙΟ ΜΕ ΤΗ ΣΥΜΒΟΛΗ ΔΕΔΟΜΕΝΩΝ ΣΥΜΒΟΛΟΜΕΤΡΙΑΣ ΜΟΝΙΜΩΝ ΣΚΕΔΑΣΤΩΝ
 EΘΝΙΚΟ ΜΕΤΣΟΒΙΟ ΠΟΛΥΤΕΧΕΙΟ Τμήμα Μηχανικών Μεταλλείων-Μεταλλουργών ΖΩΝΟΠΟΙΗΣΗ ΤΗΣ ΚΑΤΟΛΙΣΘΗΤΙΚΗΣ ΕΠΙΚΙΝΔΥΝΟΤΗΤΑΣ ΜΕ ΤΗ ΣΥΜΒΟΛΗ ΔΕΔΟΜΕΝΩΝ ΣΥΜΒΟΛΟΜΕΤΡΙΑΣ ΜΟΝΙΜΩΝ ΣΚΕΔΑΣΤΩΝ ΔΙΠΛΩΜΑΤΙΚΗ ΕΡΓΑΣΙΑ Κιτσάκη Μαρίνα
ΠΡΟΓΡΑΜΜΑ IKYDA 2012 PROGRAMME IKYDA 2012
 ΠΡΟΓΡΑΜΜΑ ΠΡΟΩΘΗΣΗΣ ΤΩΝ ΑΝΤΑΛΛΑΓΩΝ ΚΑΙ ΤΗΣ ΕΠΙΣΤΗΜΟΝΙΚΗΣ ΣΥΝΕΡΓΑΣΙΑΣ ΕΛΛΑΔΑΣ ΓΕΡΜΑΝΙΑΣ ΠΡΟΓΡΑΜΜΑ IKYDA 2012 PROGRAMME FOR THE PROMOTION OF THE EXCHANGE AND SCIENTIFIC COOPERATION BETWEEN GREECE AND GERMANY
Μετρήσεις ηλιοφάνειας στην Κύπρο
 Πτυχιακή εργασία Μετρήσεις ηλιοφάνειας στην Κύπρο Ιωσήφ Μικαίος Λεμεσός, Μάιος 2018 1 ΤΕΧΝΟΛΟΓΙΚΟ ΠΑΝΕΠΙΣΤΗΜΙΟ ΚΥΠΡΟΥ ΣΧΟΛΗ ΓΕΩΤΕΧΝΙΚΩΝ ΕΠΙΣΤΗΜΩΝ ΚΑΙ ΔΙΑΧΕΙΡΙΣΗΣ ΠΕΡΙΒΑΛΛΟΝΤΟΣ ΤΜΗΜΑ ΕΠΙΣΤΗΜΗΣ ΚΑΙ ΤΕΧΝΟΛΟΓΙΑΣ
ΦΩΤΟΓΡΑΜΜΕΤΡΙΚΕΣ ΚΑΙ ΤΗΛΕΠΙΣΚΟΠΙΚΕΣ ΜΕΘΟΔΟΙ ΣΤΗ ΜΕΛΕΤΗ ΘΕΜΑΤΩΝ ΔΑΣΙΚΟΥ ΠΕΡΙΒΑΛΛΟΝΤΟΣ
 AΡΙΣΤΟΤΕΛΕΙΟ ΠΑΝΕΠΙΣΤΗΜΙΟ ΘΕΣΣΑΛΟΝΙΚΗΣ ΠΟΛΥΤΕΧΝΙΚΗ ΣΧΟΛΗ ΤΜΗΜΑ ΠΟΛΙΤΙΚΩΝ ΜΗΧΑΝΙΚΩΝ ΠΡΟΓΡΑΜΜΑ ΜΕΤΑΠΤΥΧΙΑΚΩΝ ΣΠΟΥΔΩΝ ΕΙΔΙΚΕΥΣΗΣ ΠΡΟΣΤΑΣΙΑ ΠΕΡΙΒΑΛΛΟΝΤΟΣ ΚΑΙ ΒΙΩΣΙΜΗ ΑΝΑΠΤΥΞΗ ΔΙΠΛΩΜΑΤΙΚΗ ΕΡΓΑΣΙΑ ΦΩΤΟΓΡΑΜΜΕΤΡΙΚΕΣ
Ψηφιακή ανάπτυξη. Course Unit #1 : Κατανοώντας τις βασικές σύγχρονες ψηφιακές αρχές Thematic Unit #1 : Τεχνολογίες Web και CMS
 Ψηφιακή ανάπτυξη Course Unit #1 : Κατανοώντας τις βασικές σύγχρονες ψηφιακές αρχές Thematic Unit #1 : Τεχνολογίες Web και CMS Learning Objective : SEO και Analytics Fabio Calefato Department of Computer
Τ.Ε.Ι. ΔΥΤΙΚΗΣ ΜΑΚΕΔΟΝΙΑΣ ΠΑΡΑΡΤΗΜΑ ΚΑΣΤΟΡΙΑΣ ΤΜΗΜΑ ΔΗΜΟΣΙΩΝ ΣΧΕΣΕΩΝ & ΕΠΙΚΟΙΝΩΝΙΑΣ
 Τ.Ε.Ι. ΔΥΤΙΚΗΣ ΜΑΚΕΔΟΝΙΑΣ ΠΑΡΑΡΤΗΜΑ ΚΑΣΤΟΡΙΑΣ ΤΜΗΜΑ ΔΗΜΟΣΙΩΝ ΣΧΕΣΕΩΝ & ΕΠΙΚΟΙΝΩΝΙΑΣ ΠΤΥΧΙΑΚΗ ΕΡΓΑΣΙΑ Η προβολή επιστημονικών θεμάτων από τα ελληνικά ΜΜΕ : Η κάλυψή τους στον ελληνικό ημερήσιο τύπο Σαραλιώτου
ΕΘΝΙΚΟ ΜΕΤΣΟΒΙΟ ΠΟΛΥΤΕΧΝΕΙΟ
 ΕΘΝΙΚΟ ΜΕΤΣΟΒΙΟ ΠΟΛΥΤΕΧΝΕΙΟ ΤΜΗΜΑ ΠΟΛΙΤΙΚΩΝ ΜΗΧΑΝΙΚΩΝ ΤΟΜΕΑΣ ΟΜΟΣΤΑΤΙΚΗΣ ΕΡΓΑΣΤΗΡΙΟ ΜΕΤΑΛΛΙΚΩΝ ΚΑΤΑΣΚΕΥΩΝ ΕΙΣΑΓΩΓΗ ΣΤΟΝ ΑΥΤΟΜΑΤΟ ΕΛΕΓΧΟ ΤΩΝ ΚΑΤΑΣΚΕΥΩΝ Ανεµόµετρο AMD 1 Αισθητήρας AMD 2 11 ος όροφος Υπολογιστής
ΔΙΠΛΩΜΑΤΙΚΗ ΕΡΓΑΣΙΑ. του φοιτητή του Τμήματος Ηλεκτρολόγων Μηχανικών και. Τεχνολογίας Υπολογιστών της Πολυτεχνικής Σχολής του. Πανεπιστημίου Πατρών
 ΠΑΝΕΠΙΣΤΗΜΙΟ ΠΑΤΡΩΝ ΤΜΗΜΑ ΗΛΕΚΤΡΟΛΟΓΩΝ ΜΗΧΑΝΙΚΩΝ ΚΑΙ ΤΕΧΝΟΛΟΓΙΑΣ ΥΠΟΛΟΓΙΣΤΩΝ ΤΟΜΕΑΣ ΣΥΣΤΗΜΑΤΩΝ ΗΛΕΚΤΡΙΚΗΣ ΕΝΕΡΓΕΙΑΣ ΕΡΓΑΣΤΗΡΙΟ ΗΛΕΚΤΡΟΜΗΧΑΝΙΚΗΣ ΜΕΤΑΤΡΟΠΗΣ ΕΝΕΡΓΕΙΑΣ ΔΙΠΛΩΜΑΤΙΚΗ ΕΡΓΑΣΙΑ του φοιτητή του
ΠΑΡΟΥΣΙΑΣΗ ΙΔΕΠ ΣΥΜΒΟΥΛΕΣ ΓΙΑ ΣΩΣΤΗ ΔΙΑΧΕΙΡΙΣΗ ΕΡΓΩΝ ERASMUS+ STRATEGIC PARTNERSHIPS
 ΠΑΡΟΥΣΙΑΣΗ ΙΔΕΠ ΣΥΜΒΟΥΛΕΣ ΓΙΑ ΣΩΣΤΗ ΔΙΑΧΕΙΡΙΣΗ ΕΡΓΩΝ ERASMUS+ STRATEGIC PARTNERSHIPS ΔΡ ΣΙΛΙΑ ΧΑΤΖΗΧΡΙΣΤΟΔΟΥΛΟΥ FOUNDER AND MANAGING DIRECTOR GRANTXPERT CONSULTING LTD 06/09/2017 ΘΕΜΑΤΑ ΠΑΡΟΥΣΙΑΣΗΣ O ΡΟΛΟΣ
ΑΝΑΠΤΥΞΗ ΣΕΝΑΡΙΩΝ ΒΕΛΤΙΣΤΟΠΟΙΗΣΗΣ ΤΗΣ ΔΙΑΧΕΙΡΙΣΗΣ ΚΑΙ ΤΗΣ ΥΔΡΟΗΛΕΚΤΡΙΚΗΣ ΠΑΡΑΓΩΓΗΣ ΤΟΥ ΥΔΡΟΣΥΣΤΗΜΑΤΟΣ ΤΟΥ ΠΟΤΑΜΟΥ ΝΕΣΤΟΥ
 ΑΝΑΠΤΥΞΗ ΣΕΝΑΡΙΩΝ ΒΕΛΤΙΣΤΟΠΟΙΗΣΗΣ ΤΗΣ ΔΙΑΧΕΙΡΙΣΗΣ ΚΑΙ ΤΗΣ ΥΔΡΟΗΛΕΚΤΡΙΚΗΣ ΠΑΡΑΓΩΓΗΣ ΤΟΥ ΥΔΡΟΣΥΣΤΗΜΑΤΟΣ ΤΟΥ ΠΟΤΑΜΟΥ ΝΕΣΤΟΥ ΑΝΑΠΤΥΞΗ ΣΕΝΑΡΙΩΝ ΒΕΛΤΙΣΤΟΠΟΙΗΣΗΣ ΤΗΣ ΔΙΑΧΕΙΡΙΣΗΣ ΚΑΙ ΤΗΣ ΥΔΡΟΗΛΕΚΤΡΙΚΗΣ ΠΑΡΑΓΩΓΗΣ
ΠΕΡΙΕΧΟΜΕΝΑ. Κεφάλαιο 1: Κεφάλαιο 2: Κεφάλαιο 3:
 4 Πρόλογος Η παρούσα διπλωµατική εργασία µε τίτλο «ιερεύνηση χωρικής κατανοµής µετεωρολογικών µεταβλητών. Εφαρµογή στον ελληνικό χώρο», ανατέθηκε από το ιεπιστηµονικό ιατµηµατικό Πρόγραµµα Μεταπτυχιακών
ΚΑΘΟΡΙΣΜΟΣ ΠΑΡΑΓΟΝΤΩΝ ΠΟΥ ΕΠΗΡΕΑΖΟΥΝ ΤΗΝ ΠΑΡΑΓΟΜΕΝΗ ΙΣΧΥ ΣΕ Φ/Β ΠΑΡΚΟ 80KWp
 ΕΘΝΙΚΟ ΜΕΤΣΟΒΙΟ ΠΟΛΥΤΕΧΝΕΙΟ ΣΧΟΛΗ ΗΛΕΚΤΡΟΛΟΓΩΝ ΜΗΧΑΝΙΚΩΝ ΚΑΙ ΜΗΧΑΝΙΚΩΝ ΥΠΟΛΟΓΙΣΤΩΝ ΤΟΜΕΑΣ ΣΥΣΤΗΜΑΤΩΝ ΜΕΤΑΔΟΣΗΣ ΠΛΗΡΟΦΟΡΙΑΣ ΚΑΙ ΤΕΧΝΟΛΟΓΙΑΣ ΥΛΙΚΩΝ ΚΑΘΟΡΙΣΜΟΣ ΠΑΡΑΓΟΝΤΩΝ ΠΟΥ ΕΠΗΡΕΑΖΟΥΝ ΤΗΝ ΠΑΡΑΓΟΜΕΝΗ ΙΣΧΥ
Improvement of wave height forecast in deep and intermediate waters with the use of stochastic methods
 Improvement of wave height forecast in deep and intermediate waters with the use of stochastic methods Zoe Theocharis, Constantine Memos, Demetris Koutsoyiannis National Technical University of Athens
ΠΕΡΙΕΧΟΜΕΝΑ. Μάρκετινγκ Αθλητικών Τουριστικών Προορισμών 1
 ΠΑΝΕΠΙΣΤΗΜΙΟ ΑΙΓΑΙΟΥ ΣΧΟΛΗ ΕΠΙΣΤΗΜΩΝ ΤΗΣ ΔΙΟΙΚΗΣΗΣ ΤΜΗΜΑ ΔΙΟΙΚΗΣΗΣ ΕΠΙΧΕΙΡΗΣΕΩΝ ΔΙΑΤΜΗΜΑΤΙΚΟ ΠΡΟΓΡΑΜΜΑ ΜΕΤΑΠΤΥΧΙΑΚΩΝ ΣΠΟΥΔΩΝ «Σχεδιασμός, Διοίκηση και Πολιτική του Τουρισμού» ΜΑΡΚΕΤΙΝΓΚ ΑΘΛΗΤΙΚΩΝ ΤΟΥΡΙΣΤΙΚΩΝ
ΓΕΩΜΕΣΡΙΚΗ ΣΕΚΜΗΡΙΩΗ ΣΟΤ ΙΕΡΟΤ ΝΑΟΤ ΣΟΤ ΣΙΜΙΟΤ ΣΑΤΡΟΤ ΣΟ ΠΕΛΕΝΔΡΙ ΣΗ ΚΤΠΡΟΤ ΜΕ ΕΦΑΡΜΟΓΗ ΑΤΣΟΜΑΣΟΠΟΙΗΜΕΝΟΤ ΤΣΗΜΑΣΟ ΨΗΦΙΑΚΗ ΦΩΣΟΓΡΑΜΜΕΣΡΙΑ
 ΕΘΝΙΚΟ ΜΕΣΟΒΙΟ ΠΟΛΤΣΕΧΝΕΙΟ ΣΜΗΜΑ ΑΓΡΟΝΟΜΩΝ-ΣΟΠΟΓΡΑΦΩΝ ΜΗΧΑΝΙΚΩΝ ΣΟΜΕΑ ΣΟΠΟΓΡΑΦΙΑ ΕΡΓΑΣΗΡΙΟ ΦΩΣΟΓΡΑΜΜΕΣΡΙΑ ΓΕΩΜΕΣΡΙΚΗ ΣΕΚΜΗΡΙΩΗ ΣΟΤ ΙΕΡΟΤ ΝΑΟΤ ΣΟΤ ΣΙΜΙΟΤ ΣΑΤΡΟΤ ΣΟ ΠΕΛΕΝΔΡΙ ΣΗ ΚΤΠΡΟΤ ΜΕ ΕΦΑΡΜΟΓΗ ΑΤΣΟΜΑΣΟΠΟΙΗΜΕΝΟΤ
ΕΘΝΙΚΗ ΣΧΟΛΗ ΗΜΟΣΙΑΣ ΙΟΙΚΗΣΗΣ
 Ε ΕΘΝΙΚΗ ΣΧΟΛΗ ΗΜΟΣΙΑΣ ΙΟΙΚΗΣΗΣ ΙE ΕΚΠΑΙ ΕΥΤΙΚΗ ΣΕΙΡΑ ΤΜΗΜΑ ΓΕΝΙΚΗΣ ΙΟΙΚΗΣΗΣ ΤΕΛΙΚΗ ΕΡΓΑΣΙΑ Θέµα: Εκπαίδευση: Μέσο ανάπτυξης του ανθρώπινου παράγοντα και εργαλείο διοικητικής µεταρρύθµισης Επιβλέπουσα:
Business English. Ενότητα # 9: Financial Planning. Ευαγγελία Κουτσογιάννη Τμήμα Διοίκησης Επιχειρήσεων
 ΕΛΛΗΝΙΚΗ ΔΗΜΟΚΡΑΤΙΑ Ανώτατο Εκπαιδευτικό Ίδρυμα Πειραιά Τεχνολογικού Τομέα Business English Ενότητα # 9: Financial Planning Ευαγγελία Κουτσογιάννη Τμήμα Διοίκησης Επιχειρήσεων Άδειες Χρήσης Το παρόν εκπαιδευτικό
PROGRESS REPORT (18-MONTH) Appraisal of the Factors Influencing Public Perceptions of Water Reuse in Cyprus
 Appraisal of the Factors Influencing Public Perceptions of Water Reuse in Cyprus") PROGRESS REPORT (18-MONTH) Under the Framework Programme for Research, Technological Development and Innovation 2009-2010 of the Research Promotion Foundation Appraisal of the Factors Influencing Public
PROGRESS REPORT (18-MONTH) Under the Framework Programme for Research, Technological Development and Innovation 2009-2010 of the Research Promotion Foundation Appraisal of the Factors Influencing Public
Presentation Structure
 Improvement of wave height forecast in deep and intermediate waters with the use of stochastic methods Zoe Theocharis, Constantine Memos, Demetris Koutsoyiannis National Technical University of Athens
Web 論 文. Performance Evaluation and Renewal of Department s Official Web Site. Akira TAKAHASHI and Kenji KAMIMURA
 長 岡 工 業 高 等 専 門 学 校 研 究 紀 要 第 49 巻 (2013) 論 文 Web Department of Electronic Control Engineering, Nagaoka National College of Technology Performance Evaluation and Renewal of Department s Official Web Site
Test Data Management in Practice
 Problems, Concepts, and the Swisscom Test Data Organizer Do you have issues with your legal and compliance department because test environments contain sensitive data outsourcing partners must not see?
Αξιολόγηση των εκπαιδευτικών δραστηριοτήτων των νοσοκομειακών βιβλιοθηκών.
 Αξιολόγηση των εκπαιδευτικών δραστηριοτήτων των νοσοκομειακών βιβλιοθηκών. Καλογεράκη Ελένη Βιβλιοθήκη Γ.Ν.Α «Ο Ευαγγελισμός», Msc Inf Scienc, Κοινωνιολόγος, Βιβλιοθηκονόμoς, Σαρανταπόρου 8, Άνω Ηλιούπολη
Potential Dividers. 46 minutes. 46 marks. Page 1 of 11
 Potential Dividers 46 minutes 46 marks Page 1 of 11 Q1. In the circuit shown in the figure below, the battery, of negligible internal resistance, has an emf of 30 V. The pd across the lamp is 6.0 V and
Εκτεταμένη περίληψη Περίληψη
 PENED Final Report In the frame of PENED program the research that has been conducted as part of the Hybrid Libraries Project had as an outcome the design of a complex software architecture for mobile
ΜΟΝΤΕΛΑ ΛΗΨΗΣ ΑΠΟΦΑΣΕΩΝ
 ΜΟΝΤΕΛΑ ΛΗΨΗΣ ΑΠΟΦΑΣΕΩΝ Ενότητα 12 Τμήμα Εφαρμοσμένης Πληροφορικής Άδειες Χρήσης Το παρόν εκπαιδευτικό υλικό υπόκειται σε άδειες χρήσης Creative Commons. Για εκπαιδευτικό υλικό, όπως εικόνες, που υπόκειται
ΠΑΝΕΠΙΣΤΗΜΙΟ ΠΑΤΡΩΝ ΤΜΗΜΑ ΗΛΕΚΤΡΟΛΟΓΩΝ ΜΗΧΑΝΙΚΩΝ ΚΑΙ ΤΕΧΝΟΛΟΓΙΑΣ ΥΠΟΛΟΓΙΣΤΩΝ ΤΟΜΕΑΣ ΣΥΣΤΗΜΑΤΩΝ ΗΛΕΚΤΡΙΚΗΣ ΕΝΕΡΓΕΙΑΣ ΕΡΓΑΣΤΗΡΙΟ ΥΨΗΛΩΝ ΤΑΣΕΩΝ
 ΠΑΝΕΠΙΣΤΗΜΙΟ ΠΑΤΡΩΝ ΤΜΗΜΑ ΗΛΕΚΤΡΟΛΟΓΩΝ ΜΗΧΑΝΙΚΩΝ ΚΑΙ ΤΕΧΝΟΛΟΓΙΑΣ ΥΠΟΛΟΓΙΣΤΩΝ ΤΟΜΕΑΣ ΣΥΣΤΗΜΑΤΩΝ ΗΛΕΚΤΡΙΚΗΣ ΕΝΕΡΓΕΙΑΣ ΕΡΓΑΣΤΗΡΙΟ ΥΨΗΛΩΝ ΤΑΣΕΩΝ Διπλωµατική Εργασία Της Φοιτήτριας του Τµήµατος Ηλεκτρολόγων
ΔΘΝΙΚΗ ΥΟΛΗ ΓΗΜΟΙΑ ΓΙΟΙΚΗΗ ΚΑ ΔΚΠΑΙΓΔΤΣΙΚΗ ΔΙΡΑ ΣΔΛΙΚΗ ΔΡΓΑΙΑ
 Ε ΔΘΝΙΚΗ ΥΟΛΗ ΓΗΜΟΙΑ ΓΙΟΙΚΗΗ ΚΑ ΔΚΠΑΙΓΔΤΣΙΚΗ ΔΙΡΑ ΣΜΗΜΑ ΓΔΝΙΚΗ ΓΙΟΙΚΗΗ ΣΔΛΙΚΗ ΔΡΓΑΙΑ Θέκα: Η Γηνίθεζε Αιιαγώλ (Change Management) ζην Γεκόζην Σνκέα: Η πεξίπησζε ηεο εθαξκνγήο ηνπ ύγρξνλνπ Γεκνζηνλνκηθνύ
ΣΧΕΔΙΑΣΜΟΣ ΔΙΚΤΥΩΝ ΔΙΑΝΟΜΗΣ. Η εργασία υποβάλλεται για τη μερική κάλυψη των απαιτήσεων με στόχο. την απόκτηση του διπλώματος
 ΣΧΕΔΙΑΣΜΟΣ ΔΙΚΤΥΩΝ ΔΙΑΝΟΜΗΣ Η εργασία υποβάλλεται για τη μερική κάλυψη των απαιτήσεων με στόχο την απόκτηση του διπλώματος «Οργάνωση και Διοίκηση Βιομηχανικών Συστημάτων με εξειδίκευση στα Συστήματα Εφοδιασμού
«Χρήσεις γης, αξίες γης και κυκλοφοριακές ρυθμίσεις στο Δήμο Χαλκιδέων. Η μεταξύ τους σχέση και εξέλιξη.»
 ΕΘΝΙΚΟ ΜΕΤΣΟΒΙΟ ΠΟΛΥΤΕΧΝΕΙΟ ΣΧΟΛΗ ΑΓΡΟΝΟΜΩΝ ΚΑΙ ΤΟΠΟΓΡΑΦΩΝ ΜΗΧΑΝΙΚΩΝ ΤΟΜΕΑΣ ΓΕΩΓΡΑΦΙΑΣ ΚΑΙ ΠΕΡΙΦΕΡΕΙΑΚΟΥ ΣΧΕΔΙΑΣΜΟΥ ΔΙΠΛΩΜΑΤΙΚΗ ΕΡΓΑΣΙΑ: «Χρήσεις γης, αξίες γης και κυκλοφοριακές ρυθμίσεις στο Δήμο Χαλκιδέων.
Εργαστήριο Ανάπτυξης Εφαρμογών Βάσεων Δεδομένων. Εξάμηνο 7 ο
 Εργαστήριο Ανάπτυξης Εφαρμογών Βάσεων Δεδομένων Εξάμηνο 7 ο Procedures and Functions Stored procedures and functions are named blocks of code that enable you to group and organize a series of SQL and PL/SQL
σ σ σ :
 Erasmus... Η / : 16/10/2015..: 1048, σ, 471 00 Ά. : 26810 50544 http://erasmus.teiep.gr/ e-mail: erasmus@teiep.gr Η Η Η Η Η Η Η Η. 2015-16 σ ς σ ς "K σ σ σ STT " ς Erasmus+/ σ, σ σ ση, σ ώ. σ ς ώ ώ ώ ς
"ΦΟΡΟΛΟΓΙΑ ΕΙΣΟΔΗΜΑΤΟΣ ΕΤΑΙΡΕΙΩΝ ΣΥΓΚΡΙΤΙΚΑ ΓΙΑ ΤΑ ΟΙΚΟΝΟΜΙΚΑ ΕΤΗ 2011-2013"
 ΤΕΧΝΟΛΟΓΙΚΟ ΕΚΠΑΙΔΕΥΤΙΚΟ ΙΔΡΥΜΑ ΚΡΗΤΗΣ ΣΧΟΛΗ ΔΙΟΙΚΗΣΗΣ ΚΑΙ ΟΙΚΟΝΟΜΙΑΣ ΤΜΗΜΑ ΛΟΓΙΣΤΙΚΗΣ ΚΑΙ ΧΡΗΜΑΤΟΟΙΚΟΝΟΜΙΚΗΣ Επιμέλεια Κρανιωτάκη Δήμητρα Α.Μ. 8252 Κωστορρίζου Δήμητρα Α.Μ. 8206 Μελετίου Χαράλαμπος Α.Μ.
ΜΕΛΕΤΗ ΤΗΣ ΗΛΕΚΤΡΟΝΙΚΗΣ ΣΥΝΤΑΓΟΓΡΑΦΗΣΗΣ ΚΑΙ Η ΔΙΕΡΕΥΝΗΣΗ ΤΗΣ ΕΦΑΡΜΟΓΗΣ ΤΗΣ ΣΤΗΝ ΕΛΛΑΔΑ: Ο.Α.Ε.Ε. ΠΕΡΙΦΕΡΕΙΑ ΠΕΛΟΠΟΝΝΗΣΟΥ ΚΑΣΚΑΦΕΤΟΥ ΣΩΤΗΡΙΑ
 ΠΑΝΕΠΙΣΤΗΜΙΟ ΠΕΙΡΑΙΩΣ ΠΡΟΓΡΑΜΜΑ ΜΕΤΑΠΤΥΧΙΑΚΩΝ ΣΠΟΥΔΩΝ ΔΙΟΙΚΗΣΗ ΤΗΣ ΥΓΕΙΑΣ ΤΕΙ ΠΕΙΡΑΙΑ ΜΕΛΕΤΗ ΤΗΣ ΗΛΕΚΤΡΟΝΙΚΗΣ ΣΥΝΤΑΓΟΓΡΑΦΗΣΗΣ ΚΑΙ Η ΔΙΕΡΕΥΝΗΣΗ ΤΗΣ ΕΦΑΡΜΟΓΗΣ ΤΗΣ ΣΤΗΝ ΕΛΛΑΔΑ: Ο.Α.Ε.Ε. ΠΕΡΙΦΕΡΕΙΑ ΠΕΛΟΠΟΝΝΗΣΟΥ
Αζεκίλα Α. Μπνπράγηεξ (Α.Μ. 261)
") ΠΑΝΔΠΗΣΖΜΗΟ ΠΑΣΡΧΝ ΥΟΛΖ ΑΝΘΡΧΠΗΣΗΚΧΝ ΚΑΗ ΚΟΗΝΧΝΗΚΧΝ ΠΟΤΓΧΝ ΠΑΗΓΑΓΧΓΗΚΟ ΣΜΖΜΑ ΓΖΜΟΣΗΚΖ ΔΚΠΑΗΓΔΤΖ ΜΔΣΑΠΣΤΥΗΑΚΟ ΠΡΟΓΡΑΜΜΑ ΠΟΤΓΧΝ ΘΔΜΑ ΓΗΠΛΧΜΑΣΗΚΖ ΔΡΓΑΗΑ: Ζ ΑΝΣΗΛΖΦΖ ΣΧΝ ΔΚΠΑΗΓΔΤΣΗΚΧΝ ΓΗΑ ΣΖ ΖΜΑΗΑ ΣΖ ΑΤΣΟΔΚΣΗΜΖΖ
ΠΑΝΔΠΗΣΖΜΗΟ ΠΑΣΡΧΝ ΥΟΛΖ ΑΝΘΡΧΠΗΣΗΚΧΝ ΚΑΗ ΚΟΗΝΧΝΗΚΧΝ ΠΟΤΓΧΝ ΠΑΗΓΑΓΧΓΗΚΟ ΣΜΖΜΑ ΓΖΜΟΣΗΚΖ ΔΚΠΑΗΓΔΤΖ ΜΔΣΑΠΣΤΥΗΑΚΟ ΠΡΟΓΡΑΜΜΑ ΠΟΤΓΧΝ ΘΔΜΑ ΓΗΠΛΧΜΑΣΗΚΖ ΔΡΓΑΗΑ: Ζ ΑΝΣΗΛΖΦΖ ΣΧΝ ΔΚΠΑΗΓΔΤΣΗΚΧΝ ΓΗΑ ΣΖ ΖΜΑΗΑ ΣΖ ΑΤΣΟΔΚΣΗΜΖΖ
ΔΗΜΟΚΡΙΤΕΙΟ ΠΑΝΕΠΙΣΤΗΜΙΟ ΘΡΑΚΗΣ ΣΧΟΛΗ ΕΠΙΣΤΗΜΩΝ ΑΓΩΓΗΣ
 ΔΗΜΟΚΡΙΤΕΙΟ ΠΑΝΕΠΙΣΤΗΜΙΟ ΘΡΑΚΗΣ ΣΧΟΛΗ ΕΠΙΣΤΗΜΩΝ ΑΓΩΓΗΣ ΤΜΗΜΑ ΕΠΙΣΤΗΜΩΝ ΕΚΠΑΙΔΕΥΣΗΣ ΣΤΗΝ ΠΡΟΣΧΟΛΙΚΗ ΗΛΙΚΙΑ ΠΤΥΧΙΑΚΗ ΕΡΓΑΣΙΑ Διαπολιτισμική Εκπαίδευση και Θρησκευτική Ετερότητα: εθνικές και θρησκευτικές
CYPRUS UNIVERSITY OF TECHNOLOGY. Faculty of Engineering and Technology. Department of Civil Engineering and Geomatics. Dissertation Thesis
 CYPRUS UNIVERSITY OF TECHNOLOGY Faculty of Engineering and Technology Department of Civil Engineering and Geomatics Dissertation Thesis GEOSPATIAL TECHNOLOGIES FOR REAL ESTATE AND LAND VALUATION IN CYPRUS
ΠΑΝΕΠΙΣΤΗΜΙΟ ΠΕΙΡΑΙΩΣ ΤΜΗΜΑ ΝΑΥΤΙΛΙΑΚΩΝ ΣΠΟΥΔΩΝ ΠΡΟΓΡΑΜΜΑ ΜΕΤΑΠΤΥΧΙΑΚΩΝ ΣΠΟΥΔΩΝ ΣΤΗ ΝΑΥΤΙΛΙΑ
 ΠΑΝΕΠΙΣΤΗΜΙΟ ΠΕΙΡΑΙΩΣ ΤΜΗΜΑ ΝΑΥΤΙΛΙΑΚΩΝ ΣΠΟΥΔΩΝ ΠΡΟΓΡΑΜΜΑ ΜΕΤΑΠΤΥΧΙΑΚΩΝ ΣΠΟΥΔΩΝ ΣΤΗ ΝΑΥΤΙΛΙΑ ΕΝΑΛΛΑΚΤΙΚΕΣ ΠΗΓΕΣ ΕΝΕΡΓΕΙΑΣ ΣΤΙΣ ΘΑΛΑΣΣΙΕΣ ΜΕΤΑΦΟΡΕΣ. ΠΕΡΙΒΑΛΛΟΝΤΙΚΑ ΟΦΕΛΗ ΤΗΣ ΝΕΑΣ ΤΕΧΝΟΛΟΓΙΑΣ. ΟΙΚΟΝΟΜΙΚΑ
ΠΙΣΤΟΠΟΙΗΜΕΝΟ ΕΠΑΓΓΕΛΜΑΤΙΚΟ ΠΕΡΙΓΡΑΜΜΑ «ΧΕΙΡΙΣΤΗΣ ΚΙΝΗΤΩΝ ΜΗΧΑΝΗΜΑΤΩΝ ΜΗΧΑΝΗΜΑΤΩΝ ΕΡΓΟΥ»
 ΠΙΣΤΟΠΟΙΗΜΕΝΟ ΕΠΑΓΓΕΛΜΑΤΙΚΟ ΠΕΡΙΓΡΑΜΜΑ «ΧΕΙΡΙΣΤΗΣ ΚΙΝΗΤΩΝ ΜΗΧΑΝΗΜΑΤΩΝ ΜΗΧΑΝΗΜΑΤΩΝ ΕΡΓΟΥ» ΠΙΝΑΚΑΣ ΠΕΡΙΕΧΟΜΕΝΩΝ ΣΥΝΟΨΗ... 4 ΕΝΟΤΗΤΑ Α: «ΤΙΤΛΟΣ ΚΑΙ ΟΡΙΣΜΟΣ ΤΟΥ ΕΠΑΓΓΕΛΜΑΤΟΣ Η/ ΚΑΙ ΕΙΔΙΚΟΤΗΤΑΣ»... 14 Α.1 Προτεινόμενος
ΓΕΩΠΟΝΙΚΟ ΠΑΝΕΠΙΣΤΗΜΙΟ ΑΘΗΝΩΝ ΤΜΗΜΑ ΑΓΡΟΤΙΚΗΣ ΟΙΚΟΝΟΜΙΑΣ & ΑΝΑΠΤΥΞΗΣ
 ΓΕΩΠΟΝΙΚΟ ΠΑΝΕΠΙΣΤΗΜΙΟ ΑΘΗΝΩΝ ΤΜΗΜΑ ΑΓΡΟΤΙΚΗΣ ΟΙΚΟΝΟΜΙΑΣ & ΑΝΑΠΤΥΞΗΣ Πρόγραμμα Μεταπτυχιακών Σπουδών «Ολοκληρωμένη Ανάπτυξη & Διαχείριση Αγροτικού Χώρου» ΜΕΤΑΠΤΥΧΙΑΚΗ ΔΙΑΤΡΙΒΗ «Η συμβολή των Τοπικών Προϊόντων
ΑΡΙΣΤΟΤΕΛΕΙΟ ΠΑΝΕΠΙΣΤΗΜΙΟ ΘΕΣΣΑΛΟΝΙΚΗΣ
 ΑΡΙΣΤΟΤΕΛΕΙΟ ΠΑΝΕΠΙΣΤΗΜΙΟ ΘΕΣΣΑΛΟΝΙΚΗΣ Μελέτη των υλικών των προετοιμασιών σε υφασμάτινο υπόστρωμα, φορητών έργων τέχνης (17ος-20ος αιώνας). Διερεύνηση της χρήσης της τεχνικής της Ηλεκτρονικής Μικροσκοπίας
Terabyte Technology Ltd
 Terabyte Technology Ltd is a Web and Graphic design company in Limassol with dedicated staff who will endeavour to deliver the highest quality of work in our field. We offer a range of services such as
JEREMIE Joint European Resources for Micro to medium Enterprises
 JEREMIE Joint European Resources for Micro to medium Enterprises ΑΝΑΚΟΙΝΩΣΗ Αθήνα, 1 η Ιουνίου 2010 Σχετικά με την Πρόσκληση Υποβολής Προτάσεων στο «Σχέδιο Επιμερισμού Ρίσκου και Συγχρηματοδότησης» της
ΔΙΠΛΩΜΑΣΙΚΗ ΕΡΓΑΙΑ. του φοιτητή του Σμήματοσ Ηλεκτρολόγων Μηχανικών και. Σεχνολογίασ Τπολογιςτών τησ Πολυτεχνικήσ χολήσ του. Πανεπιςτημίου Πατρών
 ΠΑΝΕΠΙΣΗΜΙΟ ΠΑΣΡΩΝ ΣΜΗΜΑ ΗΛΕΚΣΡΟΛΟΓΩΝ ΜΗΦΑΝΙΚΩΝ ΚΑΙ ΣΕΦΝΟΛΟΓΙΑ ΤΠΟΛΟΓΙΣΩΝ ΣΟΜΕΑ: ΗΛΕΚΣΡΟΝΙΚΗ ΚΑΙ ΤΠΟΛΟΓΙΣΩΝ ΕΡΓΑΣΗΡΙΟ ΗΛΕΚΣΡΟΝΙΚΩΝ ΤΠΟΛΟΓΙΣΩΝ ΔΙΠΛΩΜΑΣΙΚΗ ΕΡΓΑΙΑ του φοιτητή του Σμήματοσ Ηλεκτρολόγων Μηχανικών
ΠΑΝΕΠΙΣΤΗΜΙΟ ΜΑΚΕΔΟΝΙΑΣ ΠΡΟΓΡΑΜΜΑ ΜΕΤΑΠΤΥΧΙΑΚΩΝ ΣΠΟΥΔΩΝ ΤΜΗΜΑΤΟΣ ΕΚΠΑΙΔΕΥΤΙΚΗΣ ΚΑΙ ΚΟΙΝΩΝΙΚΗΣ ΠΟΛΙΤΙΚΗΣ ΕΙΔΙΚΕΥΣΗ ΣΥΝΕΧΙΖΟΜΕΝΗΣ ΕΚΠΑΙΔΕΥΣΗΣ
 ΠΑΝΕΠΙΣΤΗΜΙΟ ΜΑΚΕΔΟΝΙΑΣ ΠΡΟΓΡΑΜΜΑ ΜΕΤΑΠΤΥΧΙΑΚΩΝ ΣΠΟΥΔΩΝ ΤΜΗΜΑΤΟΣ ΕΚΠΑΙΔΕΥΤΙΚΗΣ ΚΑΙ ΚΟΙΝΩΝΙΚΗΣ ΠΟΛΙΤΙΚΗΣ ΕΙΔΙΚΕΥΣΗ ΣΥΝΕΧΙΖΟΜΕΝΗΣ ΕΚΠΑΙΔΕΥΣΗΣ «Η επιμόρφωση των εκπαιδευτικών σε φροντιστήρια μέσης εκπαίδευσης:
þÿ Ç»¹º ³µÃ ± : Ãż²» Ä Â
 Neapolis University HEPHAESTUS Repository School of Economic Sciences and Business http://hephaestus.nup.ac.cy Master Degree Thesis 2015 þÿ Ç»¹º ³µÃ ± : Ãż²» Ä Â þÿãå½±¹ã ¼±Ä¹º  ½ ¼ Ãͽ  þÿ±à ĵ»µÃ¼±Ä¹º
þÿ ½ Á Å, ˆ»µ½± Neapolis University þÿ Á̳Á±¼¼± ¼Ìù±Â ¹ º à Â, Ç» Ÿ¹º ½ ¼¹ºÎ½ À¹ÃÄ ¼Î½ º±¹ ¹ º à  þÿ ±½µÀ¹ÃÄ ¼¹ µ À»¹Â Æ Å
 Neapolis University HEPHAESTUS Repository School of Economic Sciences and Business http://hephaestus.nup.ac.cy Master Degree Thesis 2016-08 þÿ µà±³³µ»¼±ä¹º ½ ÀÄž ÄÉ þÿµºà±¹ µåä¹ºî½ - ¹µÁµÍ½ à Äɽ þÿ³½îãµé½
Σπουδάστρια Δακανάλη Νικολέτα Α.Μ. 5567. "Πώς η εξέλιξη της τεχνολογίας επηρεάζει την απόδοση των επιχειρήσεων" ΠΤΥΧΙΑΚΗ ΕΡΓΑΣΙΑ
 ΤΕΧΝΟΛΟΓΙΚΟ ΕΚΠΑΙΔΕΥΤΙΚΟ ΙΔΡΥΜΑ ΑΝ. ΜΑΚΕΔΟΝΙΑΣ ΚΑΙ ΘΡΑΚΗΣ ΣΧΟΛΗ ΔΙΟΙΚΗΣΗΣ ΚΑΙ ΟΙΚΟΝΟΜΙΑΣ ΤΜΗΜΑ ΔΙΟΙΚΗΣΗΣ ΕΠΙΧΕΙΡΗΣΕΩΝ Σπουδάστρια Δακανάλη Νικολέτα Α.Μ. 5567 "Πώς η εξέλιξη της τεχνολογίας επηρεάζει την
PUBLICATION. Participation of POLYTECH in the 10th Pan-Hellenic Conference on Informatics. April 15, Nafplio
 Participation of POLYTECH in the 10th Pan-Hellenic Conference on Informatics Nafplio 15.4.2016 POLYTECH will participate as a sponsor and speaker in the 10th Pan-Hellenic Conference on Informatics organized
Section 1: Listening and responding. Presenter: Niki Farfara MGTAV VCE Seminar 7 August 2016
 Section 1: Listening and responding Presenter: Niki Farfara MGTAV VCE Seminar 7 August 2016 Section 1: Listening and responding Section 1: Listening and Responding/ Aκουστική εξέταση Στο πρώτο μέρος της
ΔΙΠΛΩΜΑΤΙΚΗ ΕΡΓΑΣΙΑ ΕΠΑΝΑΣΧΕΔΙΑΣΜΟΣ ΓΡΑΜΜΗΣ ΣΥΝΑΡΜΟΛΟΓΗΣΗΣ ΜΕ ΧΡΗΣΗ ΕΡΓΑΛΕΙΩΝ ΛΙΤΗΣ ΠΑΡΑΓΩΓΗΣ REDESIGNING AN ASSEMBLY LINE WITH LEAN PRODUCTION TOOLS
 ΔΙΑΤΜΗΜΑΤΙΚΟ ΠΡΟΓΡΑΜΜΑ ΜΕΤΑΠΤΥΧΙΑΚΩΝ ΣΠΟΥΔΩΝ ΣΤΗ ΔΙΟΙΚΗΣΗ ΤΩΝ ΕΠΙΧΕΙΡΗΣΕΩΝ ΔΙΠΛΩΜΑΤΙΚΗ ΕΡΓΑΣΙΑ ΕΠΑΝΑΣΧΕΔΙΑΣΜΟΣ ΓΡΑΜΜΗΣ ΣΥΝΑΡΜΟΛΟΓΗΣΗΣ ΜΕ ΧΡΗΣΗ ΕΡΓΑΛΕΙΩΝ ΛΙΤΗΣ ΠΑΡΑΓΩΓΗΣ REDESIGNING AN ASSEMBLY LINE WITH
Approximation of distance between locations on earth given by latitude and longitude
 Approximation of distance between locations on earth given by latitude and longitude Jan Behrens 2012-12-31 In this paper we shall provide a method to approximate distances between two points on earth
Ζητήματα Τυποποίησης στην Ορολογία - ο ρόλος και οι δράσεις της Επιτροπής Ορολογίας ΤΕ21 του ΕΛΟΤ
 1 Ζητήματα Τυποποίησης στην Ορολογία - ο ρόλος και οι δράσεις της Επιτροπής Ορολογίας ΤΕ21 του ΕΛΟΤ ΠΕΡΙΛΗΨΗ Μαριάννα Κατσογιάννου, Κατερίνα Τοράκη Στην παρούσα εισήγηση παρουσιάζεται η λειτουργία και
ΕΘΝΙΚΟ ΜΕΤΣΟΒΙΟ ΠΟΛΥΤΕΧΝΕΙΟ ΣΧΟΛΗ ΠΟΛΙΤΙΚΩΝ ΜΗΧΑΝΙΚΩΝ. «Θεσμικό Πλαίσιο Φωτοβολταïκών Συστημάτων- Βέλτιστη Απόδοση Μέσω Τρόπων Στήριξης»
 ΕΘΝΙΚΟ ΜΕΤΣΟΒΙΟ ΠΟΛΥΤΕΧΝΕΙΟ ΣΧΟΛΗ ΠΟΛΙΤΙΚΩΝ ΜΗΧΑΝΙΚΩΝ ΤΟΜΕΑΣ ΑΝΘΡΩΠΙΣΤΙΚΩΝ & ΚΟΙΝΩΝΙΚΩΝ ΕΠΙΣΤΗΜΩΝ ΚΑΙ ΔΙΚΑΙΟΥ «Θεσμικό Πλαίσιο Φωτοβολταïκών Συστημάτων- Βέλτιστη Απόδοση Μέσω Τρόπων Στήριξης» Διπλωματική
ΠΟΛΤΣΔΥΝΔΗΟ ΚΡΖΣΖ ΣΜΖΜΑ ΜΖΥΑΝΗΚΧΝ ΟΡΤΚΣΧΝ ΠΟΡΧΝ
 ΠΟΛΤΣΔΥΝΔΗΟ ΚΡΖΣΖ ΣΜΖΜΑ ΜΖΥΑΝΗΚΧΝ ΟΡΤΚΣΧΝ ΠΟΡΧΝ ΓΗΠΛΧΜΑΣΗΚΖ ΔΡΓΑΗΑ ΔΦΑΡΜΟΓΔ ΓΔΧΘΔΡΜΗΑ ΥΑΜΖΛΖ ΔΝΘΑΛΠΗΑ ΣΖΝ ΠΔΡΗΟΥΖ ΑΛΔΞΑΝΓΡΔΗΑ Ν. ΖΜΑΘΗΑ ΓΗΑΜΑΝΣΟΠΟΤΛΟ Η. ΦΧΣΗΟ ΔΞΔΣΑΣΗΚΖ ΔΠΗΣΡΟΠΖ: ΘΔΟΓΧΡΟ ΜΑΡΚΟΠΟΤΛΟ Καζεγεηήο
Μειέηε, θαηαζθεπή θαη πξνζνκνίσζε ηεο ιεηηνπξγίαο κηθξήο αλεκνγελλήηξηαο αμνληθήο ξνήο ΓΗΠΛΩΜΑΣΗΚΖ ΔΡΓΑΗΑ
 Μειέηε, θαηαζθεπή θαη πξνζνκνίσζε ηεο ιεηηνπξγίαο κηθξήο αλεκνγελλήηξηαο αμνληθήο ξνήο ΓΗΠΛΩΜΑΣΗΚΖ ΔΡΓΑΗΑ Κνηζακπφπνπινο Υ. Παλαγηψηεο Δπηβιέπσλ: Νηθφιανο Υαηδεαξγπξίνπ Καζεγεηήο Δ.Μ.Π Αζήλα, Μάξηηνο 2010
Τα Προγράμματα Ευρωπαϊκής Εδαφικής Συνεργασίας συγχρηματοδοτούνται από την Ευρωπαϊκή Ένωση και Εθνικών Πόρους των κρατών, που συμμετέχουν σε αυτά
 6 th 6 th MONITORING COMMITTEE MEETING BANSKO, 26.5.2015 Priority Axis 4: TECHNICAL ASSISTANCE State of Play Aphrodite LIOLIOU Unit D Administration and Informatics T.A. contributes to the effective implementation