,**/ - CP TDN * +1-1,.- **-. * + + + +/0 2/*.,**. 0,-,**. ++. 1/ ++* kg CP TDN 2 CP 3./ TDN 1/ CP 3./ TDN / 1* TDN,,/, ++-.1 1.2 kg ++,.* -./ kg., + CP ADF P *.*/ CP TDN E#ects of Low-CP and Low-TDN Feeding on the Growth, Meat Quality, and Nitrogen Excretion of Fattening Pigs S. IKEDA, S. SUKEMORI, S. SUZUKI, and Y. KURIHARA Tokyo University of Agriculture, Department of Animal Science, Funako +1-1, Atsugi-shi, Kanagawa,,.- **-., Japan Tokyo University of Agriculture, College of Bio-production Technology, Sakuragaoka + + +, Setagaya-ku, Tokyo, +/1 *2*., Japan 8
,**/ - CP TDN + 2 CP 2 3 +,, CP CP TDN CP CP TDN + 2, CP TDN CP TDN, - + +332 +* 1* kg ++* kg TDN 1/ CP -./ 3./ ++ L TDN CP TDN CP 3./ TDN / 1*.*, - mm,.,/, + +- AM/ : ** PM0 : **, +/* cm /* cm 2* cm + 2 mm 1/ kg -. 1/ kg ++* kg +, AM3 : -*, PM. : -* +2 cm 0* +, l + KCC- +/*S +/* kg + g + 9
,**/ - + Table +. Ingredients and composition of feed Control group Test group Mixing ratio ( ) Maize Barley Soybean meal Fish meal (CP0/ ) Soybean oil Corn cob meal L-lysine HCL CaCO - CaHPO. NaCl Mineral pre-mix. + Vitamin ADE mix., Vitamin B mix. - Composition* ( ) CP TDN Carolie (Mcal/kg) 034/,+41,4. *4+ +4* -4* *4, *43 *41 *4, *4+ *4+ *4+ /04-2,24-*,40/ *4+* *4+* +*4** *4+3 +4** *42* *4+2 *4+* *4+* *4+* + - USL- +,,, + +* ++ 34/, 1142- -43. 34., 1*4/- -42/ * Composition indicates real values. + (g/kg) ; MnSO. : +-1./, FeSO. : +-0, CuSO. :,/.+, ZnCO - : 0*, CaI, : +./., (unit/g) ; Vitamin A : +*,*** IU, Vitamin D :,,*** IU, Vitamin E : +* mg - (g/kg) ; Thiamine : +.*, Riboflavine : 1.*, Pyridoxine : *./, Niacinamide : 0.*, Ca-pantothenate : +*.3, Choline chloride : /1.0 3* kg 1 1 CP ADF 0* 10
,**/ - CP TDN + mm ADF +, /,. +, - - mm CP +, +- +- 0 + CR,*E : +/ : -,*** rpm : +* +, - 0 -* g 3** ml -* g -* g,2, No. -D,/ /** ppm 0 0 30 NH. NO - SCL-+*A, SIL-+*A, LC-+*AD, DGU-+,A, CDD-0A, CTO-+*A, C-R1Aplus 1 / +, 1/ kg ++* kg ++-.1 1.2 kg ++,.* -./ kg., + +* + P *.*/, - 11
,**/ - Table,., Results of growth test Body weight gain (g/head/day) Feed intake (g/head/day) CP-intke (g/head/day) TDN-intake (g/head/day) Water intake (g/head/day) Feed E$ciency ( ) Feces amount (g/head/day) Urea amount (g/head/day) Enlarging of body length (cm) heart girth (cm) cannon circumference (cm) withers height (cm) chest depth (cm) front width (cm) chest width (cm) back width (cm) hight at hip cross (cm) rib eye area (cm, ) back fat thickness (cm) Control group 3-/ 0.,300,2,,2,,1,-*2,,* -0.-..- -+43 +4/ ++-. +/3 b +*+0 1/ +-40 +40 +141 *4/ +41 *4-34* +4+ 041 *4-.4- *4/ /4. *4/.4* *4/ +*4* *40 ++40,4. *43 *4+ Test group 23*.3 -,*+ +*, -*, +*,,/2 1, -.*2 /*1,143 +41 +30. +/1 a ++.2 3. ++4- *43 +14/ *4. +40 *4, +*4/ +4, 04* *4/.42 *4/.4/ *40-41 *4-34- +4* 24,,4, *41 *4+ Mean S.E., n. There is a significant di#erence among the di#erent superscript letters (P *.*/).. CP ADF P *.*/ P *.*/ DCP P *.*/ DE - / +, 0 CP 12
,**/ - CP TDN - DCP DE Table -. Digestibilities, DCP, and DE values in feed Control group Test group Crude protein ( ) Ether extracts ( ) Nitrogen free extracts ( ) Crude fiber ( ) ADF ( ) Carolie ( ) DCP ( ) DE (Mcal/kg) 2.4- +4, a 2*43,42 a 3*42 +4*,.4-.4+ /*4..4, a 1,4/ +42 a 24* *4+ a -4*0 1242 +4+ b 0,4*.40 b 2241-42 +/41.42 -.40 +43 b 0*4.,4, b 14. *4+ b,42- Mean S.E., n. There is a significnat di#erence among the di#erent superscript letters (P *.*/). Table... g Nitrogen balance at digestion trial (g/head/day) Control group Test group Nitrogen intake amount Feces nitrogen amount Feces nitrogen ratio ( ) Uric nitrogen amount Uric nitrogen ratio ( ) NH. (mg/head/day) NO - (mg/head/day) Nitrogen deposit amount.24*.4* 141 +4, b *401 *4*, +04, *43 +40 *4+,-,*,,* /*4* -4+,.4+,4* /.41 +41 ++41 +4+ a *4/3 *4*+ +041 *42 +4/ *4+ -0+- ++23 2-4.,+4+,04. *41 Mean S.E., n. There is a significant di#erence among the di#erent superscript letters (P *.*/)... 3/ NH. NO - / 0 + +2,. 0*3-2 ppm -0.,.13.2 ppm.2 /. 13
,**/ - Table /. / Results of carcass determination Carcass weight (kg) Carcass ratio ( ) Carcass length (cm) Back and loin length (I) (cm) Back and loin length (II) (cm) Carcass width (cm) Back fat thickness Sholder (cm) Back (cm) Loin (cm) Harf point of carcass length (cm) Front point of top of ham (cm) Middle point of top of ham (cm) Rear point of top of ham (cm) Front loin (cm) Middle loin (cm) Rear loin (cm) Mean S.E., n. Control group 1/42 04-004. +4* 3,4+ *42 1043 *42 014, *41-041 +4/.4/ *4-,41 *4- -42 *4, -4* *4- -4, *4,,4/ *4- -42 *4-,4/ *4, /41 *4- -41 *40 Test group 1.4.,4/ 004. *4/ 3,40 +4* 1140 *41 014- *42-041 *41 /4+ *4.,4/ *4, -4. *4-,41 *4, -4+ *4-,4+ *4, -4- *4, -4* *4-04. *41.4+ *4- Table 0. 0 Chemical composition of loin eye and character of back fat Loin eye Moisture ( ) Crude protein ( ) Ether extracts ( ) Crude ash ( ) Back fat Meltical point upper layer ( ) lower layer ( ) Iodine value upper layer lower layer Mean S.E., n. Control group 0042 *43,*4+ *4/ +-4* +4- +4. *4+.+41,4,.040 *43 0,4, +43 /*41 *41 Test group 0140 *42,*4, *4+ ++4- +4* +4. *4+.+43 +41.14/ +4+ 0*4. *4. /+41 *4-14
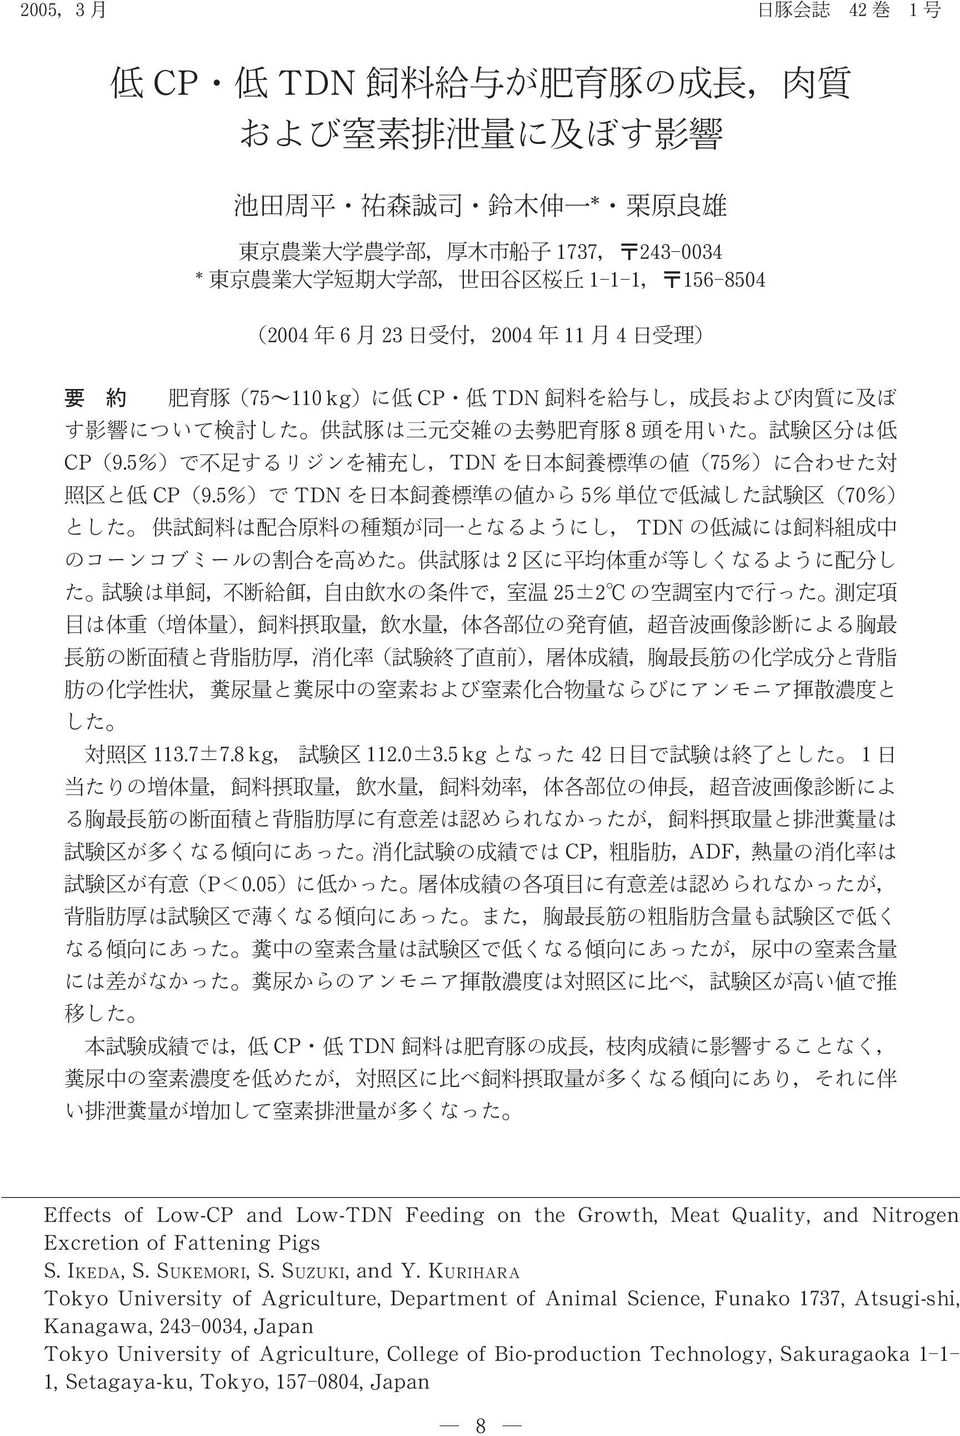
,**/ - CP TDN Fig +. Chlonological change of ammonia gass emission /+0./ ppm,. /. 0-, 0, 010 +,, ppm,. -0 /. / TDN CP TDN 0 0 + +- kg TDN 0 CP +* CP CP CP +, 2 TDN TDN TDN +332 +* / + +* / TDN 15
,**/ - + TDN CP ADF P *.*/ +. / +. 0 CP NSP, - mm TDN + 1.1 +., g ++.1 +.+ g *.+ +** g + +0., *.3 g +0.1 *.2 g / CP TDN TDN, - mm BELLEGO +/ CP +, 1 +, CP +/ 16
,**/ - CP TDN + : -. +/,+ +331., : +, +/,1,***. - : -3 1+ 12,**,.. : -3 + 1,**,. / : TDN CP.* +,+ +,2,**-. 0 :.* +,3 +-.,**-. 1 :.* +-/ +.*,**-. 2 :.* +11 +2/,**-. 3 :.+ + +*,**.. +* : +332 +332. ++ :,**,,**,. +, : 00 3. +33+. +- :, + +* +30/. +. :,,1,.,3 +33*. +/ BELLEGO, L.Le., J.M. MILGEN,S.DUBOIS and J. NOBLET : Energy utilization of lowprotein diets in growing pigs, J. Anim. Sci., +,/3 +,1+,,**+. 17
,**/ - E#ects of Low-CP and Low-TDN Feeding on the Growth, Meat Quality, and Nitrogen Excretion of Fattening Pigs Shuhei IKEDA, Seizi SUKEMORI, Shinichi SUZUKI, and Yoshio KURIHARA Tokyo University of Agriculture, Department of Animal Science, Funako +1-1, Atsugi-shi, Kanagawa,,.- **-., Japan Tokyo University of Agriculture, College of Bio-production Technology, Sakuragaoka + + +, Setagaya-ku, Tokyo, +/1 *2*., Japan In this experiment, we examined the e#ects of CP and TDN reduction on the growth, meat quality, and nitrogen excretion of eight fattening crossbred pigs (1* ++* kg). Two types of feed were prepared as follows : as a control, low-cp and standard-tdn feed (3./ 1/ ) and as experimental feed, low-cp and low-tdn feed (3./ 1* ). Both of them were supplemented with lysine. They were formulated using the same ingredients and TDN decrease was induced by increasing the corn cob meal ratio in the feed. The animals were divided into the above-mentioned two groups having the same mean body weight. Experimental feeding was conducted in a temperature-controlled room at,/, using a single cage with feed and water given ad libitum. Feed intake, water drinking, feces, and urea were determined every day. Body weight and body size were determined every week. Digestion trial was conducted in the last week. The loin area and backfat thickness at the starting point and end of experiment were determined using ultrasonic measurement. After slaughtering, carcass measurements and analyses of the chemical composition of the loin and the chemical character of the backfat were conducted. Furthermore the fecal and urinal nitrogen and ammonium gas generation density from these was determined. It took., days to reach a mean body weight of ++* kg in both groups. While there was no significant di#erence in the daily body weight gain, feed intake, water drinking, feed e$ciency, body size measurements, loin area obtained by ultrasonic measurement, and backfat thickness, feed intake and feces amount tended to increase in the experimental feed group. Digestibilities of CP, ether extracts, ADF, and calories in the experimental feed group showed significantly lower values than those in the control group and the DCP values in the experimental feed group were also significantly (P *.*/) lower than those in the control feed group. There was no significant di#erence in the results of carcass measurements, but the backfat thickness in the experimental feed group tended to be slightly thinner. Ether extract contents in loin also tended to decrease in the experimental feed group. Nitrogen contents in feces and urea tended to decrease in the experimental feed group, but the ammonium gas generation changed with a higher value in the experimental feed group. 18
,**/ - CP TDN Present results were concluded as follows ; the low-cp and low-tdn feeding did not reduce the growth and evaluation of carcass and it reduced the concentration of nitrogen in feces and urea, however it tended to consume more feed and excrete more feces and urea. Therefore a high absolute value of nitrogen was excreted in the low-cp and low-tdn feeding. Jpn. J. Swine Science,.,, + : 2 +3 Key words : Low-CP and Low-TDN feed, Growth, Meat quality, Nitrogen excretion 19