Statistical Inference
|
|
|
- Κηφάς Κοντολέων
- 8 χρόνια πριν
- Προβολές:
Transcript
1 Statistical Inference ANOVA - Nonparametric Statistics Sonia Malefaki Department of Mechanical Engineering & Aeronautics University of Patras, Greece. : , : smalefaki@upatras.gr March 14, 2017
2 Outline 1 Analysis of Variance - ANOVA One-way ANOVA 2 Chi-Square tests Goodness-of-fit test Test of independence Test of Homogeneity Test for several proportions 3 Nonparametric Tests Sign Test Wilcoxon signed-rank test Kruskal Wallis Test Run Test
3 Analysis of Variance
4 Introduction Goal: To test the hypothesis H 0 : µ 1 = µ 2 =... = µ k where k is the number of independent populations We can do all the possible tests in pairs. In this case, the probability of Type I Error increases, i.e. the possibility to obtain statistically significant differences when in fact there are not. For example if k = 10, there are 45 possible pairs for testing. By using α = 5% in each of these tests, tests may give us statistically significant differences in means completely at random. Thus, a new methodology is required.
5 One-way ANOVA H 0 : µ 1 = µ 2 = = µ k vs H 1 : at least one µ i differs Y ij i-th observation that belongs to j-th group, i = 1,..., n j and j = 1,..., k n j Y j = Y ij the sum of observations of the j-th group. i=1 n j Y j = 1 Y ij sample mean of j-th group n j i=1 n k j Y = Y ij the sum of all the observations Y = 1 n j=1 i=1 n j k j=1 i=1 Y ij the sample mean, where n = k j=1 n j
6 One-way ANOVA Two sources of variability in the data: variation among observations within a population variation among populations that is due to the differences in the characteristics of the population, Part of the goal of the analysis of variance is to determine if the differences among the k sample means are what we would expect due to random variation alone or, rather, due to variation beyond merely random effects. Assumptions The k populations are independent and normally distributed with means µ 1,..., µ k and common variance σ 2
7 One-way ANOVA y ij y = y ij y j + y j y y ij y j variability within group y j y variability between groups. If the variability between groups is large and the variability within groups is small, the null hypothesis must be rejected. If the variability between groups is small and the variability within groups is large, the null hypothesis must not be rejected. n k j (y ij y) 2 = j=1 i=1 n k j (y ij y j ) 2 + j=1 i=1 where SST Total Sum of Squares SSW Sum of Squares Within group SSB Sum of Squares Between groups MSW = SSW n k, k n j (y j y ) 2 j=1 SSB MSB = k 1, F = MSB MSW F k 1,n k Thus, at α% significance level, the hull hypothesis is rejected if F > F k 1,n k a.
8 One-way ANOVA Variability Degrees of Freedom Sum of Squares Mean Square Between groups k 1 k n j (y j y ) 2 SSB = SSB k 1 = MSB j=1 Within groups n k n k j (y ij y j ) 2 = SSW SSW n k = MSW j=1 i=1 Total n 1 n k j (y ij y ) 2 SST = SST n 1 = MST j=1 i=1 F = MSB MSW F k 1,n k Reject H 0 when F > F k 1,n k,a.
9 One-way ANOVA Homoscedasticity. Levene s test is applied for testing the equality of variances in the k populations which is a generalization of the standard F-test for testing the equality of variances in two populations. When the above assumptions are not valid, either the response variable is transformed, or the corresponding nonparametric test, named Kruskal Wallis test is applied. If H 0 is rejected, i.e. if it is assumed that there is a statistically significant difference between three or more groups, then it is important to find between which groups there is difference. Bonferroni s method. N tests are applied and the p value is readjusted to p = N p with the assumption that p 1.
10 One-way ANOVA 22 patients who underwent heart surgery were divided into three groups. Group 1. Patients who were treated with a mixture of 50% nitrous oxide and 50% oxygen for 24 hours. Group 2. Patients who were treated with a mixture of 50% nitrous oxide and 50% oxygen Only during surgery. Group 3. Patients who were treated with a mixture of 35 50% nitrous oxide and 50% oxygen for 24 hours. In the following table the value of folic acid mg/l in erythrocytes of patients is presented. Patients Group 1 Group 2 Group Do the patients of the three groups have the same mean level of folic acid mg/l in their erythrocytes?
11 Βασικά παραγοντικά πειράματα Επίδραση δύο ή περισσοτέρων παραγόντων πάνω σε μία μεταβλητή απόκρισης Γίνονται παρατηρήσεις της μεταβλητής απόκρισης πάνω σε όλους τους συνδυασμούς των επιπέδων των παραγόντων Επιδράσεις στη μεταβλητή απόκρισης Κύριες επιδράσεις των παραγόντων Αλληλεπιδράσεις δύο ή περισσότερων παραγόντων Απλές γραφικές παραστάσεις Στατιστική συμπερασματολογία
12 Παραγοντικά πειράματα πειράματα στα οποία υπεισέρχονται δύο ή περισσότεροι παράγοντες και όλα τα επίπεδα τους ενός παράγονται συνδυάζονται με τα επίπεδα όλων των άλλων παραγόντων για να παρατηρηθεί η μεταβλητή απόκρισης σε κάθε συνδυασμό. Παράδειγμα: Εστω ότι έχουμε ένα παραγοντικό πείραμα με δύο παράγοντες, το Μορφωτικό επίπεδό με 4 επίπεδα (αναλφάβητος, πρωτοβάθμια, δευτεροβάθμια και τριτοβάθμια εκπαίδευση) και το ετήσιο εισόδημα (< ευρώ, ευρώ και > ευρώ). Σύνολο θεραπειών: 4 3 = 12 Μετράμε τη μεταβλητή απόκρισης μέσα σε κάθε μία από αυτές τις θεραπείες. Μπορούμε να έχουμε μία ή περισσότερες παρατηρήσεις της μεταβλητής απόκρισης μέσα σε κάθε θεραπεία.
13 Είδη παραγόντων Σταθεροί: τα επίπεδα τους είναι συγκεκριμένα και είναι αυτά για τα οποία ενδιαφερόμαστε. Το ενδιαφέρον μας επικεντρώνεται στις μέσες τιμές της απόκρισης που αντιστοιχεί στους συνδυασμούς αυτών των επιπέδων Τυχαίοι: τα επίπεδα του παράγοντα που χρησιμοποιούνται είναι ένα τυχαίο δείγμα από το σύνολο των δυνατών επιπέδων του παράγοντα. Το ενδιαφέρον μας επικεντρώνεται στην ανάλυση της διασποράς της μεταβλητής απόκρισης σε επιμέρους όρους και στην εκτίμηση των συνιστωσών της διασποράς που οφείλεται στις επιδράσεις των παραγόντων.
14 Κύριες επιδράσεις και αλληλεπιδράσεις παραγόντων Επιδράσεις παραγόντων: Μέσες μεταβολές της απόκρισης που αντιστοιχούν σε αλλαγές των θεραπειών. Εστω ότι έχουμε ένα παραγοντικό πείραμα με δύο παράγοντες Α (με α επίπεδα) και Β (με β επίπεδα) Σύνολο θεραπειών: α β µ ij μέση απόκριση για το επίπεδο i του παράγοντα Α και το επίπεδο j του παράγοντα Β. β j=1 µ i = µ ij β α i=1 µ j = µ ij α μέση απόκριση για το επίπεδο i του παράγοντα Α. μέση απόκριση για το επίπεδο j του παράγοντα Β. α β i=1 j=1 µ = µ ij γενική μέση τιμη αβ Κύριες επιδράσεις: Η επίδραση που έχει κάθε παράγοντας ξεχωριστά στην απόκριση χωρίς να λαμβάνεται υπόψη η επίδραση των άλλων παραγόντων. α i = µ i µ, i = 1,... α κύρια επίδραση του παράγοντα Α. β j = µ j µ, j = 1,... β κύρια επίδραση του παράγοντα Β.
15 Δειγματικές μέσες τιμές nk=1 y ȳ ij = ijk δειγματικός μέσος που αντιστοιχεί στη θεραπεία (i, j) n i = 1,..., α, j = 1,..., β β nk=1 y j=1 ijk ȳ i = δειγματικός μέσος των παρατηρήσεων του i επιπέδου nβ του παράγοντα Α i = 1,..., α. αi=1 nk=1 y ijk ȳ j = δειγματικός μέσος των παρατηρήσεων του j επιπέδου nα του παράγοντα Β j = 1,..., β. ȳ = αi=1 β nk=1 y j=1 ijk nαβ Δειγματικές κύριες επιδράσεις ˆα i = ȳ i ȳ, i = 1, α γενικός μέσος. ˆβ j = ȳ j ȳ, j = 1, β α i=1 ˆα i = 0, β ˆβ j=1 j = 0
16 Αλληλεπιδράσεις Κοινή επίδραση των παραγόντων πάνω στη μεταβλητή απόκρισης Χωρίς Συνεργατική Ανταγωνιστική αλληλεπίδραση αλληλεπίδραση αλληλεπίδραση
17 Αλληλεπιδράσεις µ ij = µ + α i + β j + (αβ) ij (αβ) ij = µ ij (µ + α i + β j ) = µ ij µ i µ j + µ αλληλεπίδραση του παράγοντα Α και Β στη θεραπεία (i, j). Δειγματική αλληλεπίδραση ˆ (αβ) ij = ȳ ij (ȳ + ˆα i + ˆβ j ) = ȳ ij ȳ i ȳ j + ȳ α (αβ) ˆ ij = 0, j = 1... β i=1 β (αβ) ˆ ij = 0, i = 1... α j=1
18 Παραγοντικό πείραμα τριών παραγόντων Α, Β, C παράγοντες με α, β και c επίπεδα αντίστοιχα. Α, Β, C κύριες επιδράσεις ΑΒ, ΑC, ΒC αλληλεπιδράσεις πρώτης τάξης ΑΒC αλληλεπίδραση δεύτερης τάξης, αλληλεπίδραση μεταξύ όλων των παραγόντων, ορίζεται με την βοήθεια α β c όρων Πλεονεκτήματα παραγοντικών πειραμάτων γίνεται δυνατή η αποτίμηση των κοινών επιδράσεων δύο ή περισσοτέρων παραγόντων, δηλαδή η αλληλεπίδραση τους. όλες οι παρατηρήσεις χρησιμοποιούνται για την εκτίμηση των επιδράσεων των παραγόντων. Κάθε παρατήρηση δίνει πληροφορίες για όλους τους παράγοντες που υπεισέρχονται στο πείραμα. Δεν μένουν παρατηρήσεις ανεκμετάλλευτες στην τελική αποτίμηση των κύριων επιδράσεων και αλληλεπιδράσεων Τα αποτελέσματα που εξάγονται από αυτά ισχύουν σε ένα μεγάλο εύρος πειραματικών συνθηκών
19 Συμπερασματολογία σε παραγοντικό πείραμα πλήρους τυχαιοποίησης y ijk = µ + α i + β j + (αβ) ik + ɛ ijk i = 1,, α, j = 1,, β, k = 1,, n όπου ɛ ijk N(0, σ 2 ) τυχαία σφάλματα, α α i = 0, i=1 β β j = 0 y ijk απόκριση που παρατηρείται στην k επανάληψη του πειράματος για τη θεραπεία (i, j). µ γενικός μέσος α i κύρια επίδραση παράγονται Α, i = 1,, α β j κύρια επίδραση παράγονται Β, j = 1,, β (αβ) ij αλληλεπίδραση των παραγόντων Α και Β στη θεραπεία (i, j) i = 1,, α j = 1,, β (το παραπάνω πρότυπο γενικεύεται εύκολα για περισσότερους παράγοντες) j=1
20 Ελεγχοι Υποθέσεων Ελεγχος Υπόθεσης κύριων επιδράσεων παράγοντα Α H 0 : α i = 0, i = 1,..., α κατά H 1 : τουλάχιστον ένα α i 0 Ελεγχος Υπόθεσης κύριων επιδράσεων παράγοντα Β H 0 : β j = 0, j = 1,..., β κατά H 1 : τουλάχιστον ένα β j 0 Ελεγχος Υπόθεσης αλληλεπιδράσεων μεταξύ των παραγόντων Α και Β H 0 : (αβ) ij = 0, i = 1,..., α, j = 1,..., β κατά H 1 : τουλάχιστον ένα (αβ) ij
21 Ανάλυση Διασποράς με δύο παράγοντες α β n α β (y ijk y ) 2 = bn (y i y ) 2 + an (y j y ) 2 + i=1 j=1 k=1 i=1 j=1 α β α β n n (y i y i y j + y ) 2 + (y ijk y ij ) 2 i=1 j=1 i=1 j=1 k=1 SST = SSA + SSB + SSAB + SSE Βαθμοί Ελευθερίας αβn 1 = (α 1) + (β 1) + (α 1)(β 1) + αβ(n 1)
22 Ανάλυση Διασποράς με δύο παράγοντες MSA = MSA = SSA α 1, SSB MSB = β 1 SSAB SSBE, MSE = (α 1)(β 1) αβ(n 1) F = MSA MSE F α 1,αβ(n 1), F = MSB MSE F β 1,αβ(n 1) F = MSAB MSE F (α 1)(β 1),αβ(n 1) Άρα σε επίπεδο σημαντικότητας a απορρίπτουμε τη μηδενική υπόθεση αν F > F dfar,αβ(n 1). Analyze General Linear Model Univariate
23 Ανάλυση Διασποράς με δύο παράγοντες Μεταβλητότητα Βαθμοί Άθροισμα Τετραγωνικός F έλεγχοι ελευθερίας τετραγώνων μέσος SSA Παράγοντας Α α 1 SSA α 1 = MSA MSA MSE SSB Παράγοντας Β β 1 SSB β 1 = MSB MSB MSE Αλληλεπίδραση ΑΒ (α 1)(β 1) SSAB SSAB (α 1)(β 1) = MSAB MSAB MSE SSE Σφάλματα (ΣΣΕ) αβ(n 1) SSE αβ(n 1) = MSE Ολική αβn 1 SST SST αβn 1 = MST F = MSA MSE F α 1,αβ(n 1) απορρίπτουμε την H 0 όταν F > F α 1,αβ(n 1). F = MSB MSE F β 1,αβ(n 1) απορρίπτουμε την H 0 όταν F > F β 1,αβ(n 1). F = MSAB MSE F (α 1)(β 1),αβ(n 1) απορρίπτουμε την H 0 όταν F > F (α 1)(β 1),αβ(n 1).
24 Παραγοντικά πειράματα με σταθερούς παράγοντες χωρίς επανάληψη (n = 1) y ij = µ + α i + β j + (αβ) ij + ɛ ij, i = 1,, α, j = 1,, β, όπου ɛ ij N(0, σ 2 ) τυχαία σφάλματα. Δεν έχουμε μεταβλητότητα μέσα σε κάθε θεραπεία Μηδενίζονται οι βαθμοί ελευθερίας των σφαλμάτων Δεν είναι δυνατή η συμπερασματολογία σε αυτό το πρότυπο αν δεν υποθέσουμε ότι δεν υπάρχει αλληλεπίδραση μεταξύ των παραγόντων Α και Β y ij = µ + α i + β j + ɛ ij, i = 1,, α, j = 1,, β,
25 Ανάλυση Διασποράς με δύο παράγοντες Μεταβλητότητα Βαθμοί Άθροισμα Τετραγωνικός F έλεγχοι ελευθερίας τετραγώνων μέσος SSA Παράγοντας Α α 1 SSA α 1 = MSA MSA MSE Παράγοντας Β β 1 SSB SSB β 1 = MSB MSB MSE SSE Σφάλματα (α 1)(β 1) SSE (α 1)(β 1) = MSE Ολική αβ 1 SST SST αβ 1 = MST F = MSA MSE F α 1,(α 1)(β 1) απορρίπτουμε την H 0 όταν F > F α 1,(α 1)(β 1). F = MSB MSE F β 1,(α 1)(β 1) απορρίπτουμε την H 0 όταν F > F β 1,(α 1)(β 1).
26 Άσκηση Ο υπεύθυνος ποιότητας μιας βιομηχανίας παραγωγής επίπλων κουζίνας θέλησε να διερευνήσει το κατά πόσο η αντοχή των συγκολλήσεων τύπου ΤΑΥ επηρεάζεται από τον τύπο του μίγματος της κόλλας που χρησιμοποιείται για τις κολλήσεις καθώς και από τη θερμοκρασία του μίγματος κατά τη διαδικασία της κόλλησης. Η θερμοκρασία του μίγματος της κόλλας μπορεί να ρυθμιστεί με ακρίβεια σε τρία διαφορετικά επίπεδα (50 o C, 60 o C και 70 o C) με χρήση ειδικού μηχανήματος συγκόλλησης που διαθέτει η βιομηχανία. Ο υπεύθυνος θεωρεί πως πρέπει να ελέγξει και τους τέσσερις τύπους μίγματος κόλλας που είναι διαθέσιμοι στην αγορά. Για το σκοπό αυτό σχεδιάζει ένα πείραμα στο οποίο γίνονται συγκολλήσεις τύπου ΤΑΥ για διάφορους συνδυασμούς μίγματος κόλλας και θερμοκρασίας μίγματος και μετράται η δύναμη (σε Newton) που πρέπει να εφαρμοστεί (κάθετα) στο ελεύθερο άκρο του οριζόντιου δοκού ώστε να επέλθει η ρήξη του δεσμού που πραγματοποιήθηκε. Τα δεδομένα του πειράματος δίνονται στον πίνακα που ακολουθεί.
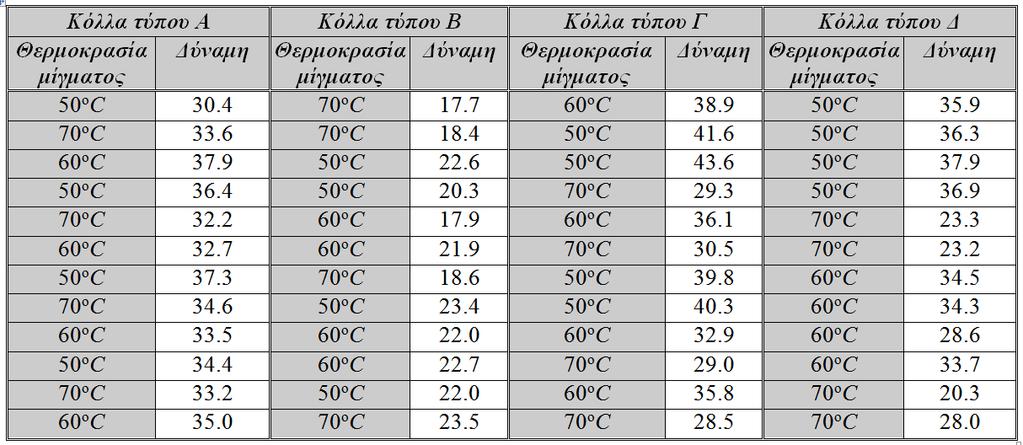
27 Άσκηση
28 Άσκηση 1 Αναγνωρίστε το είδος του σχεδιασμού που χρησιμοποιήθηκε, τη μεταβλητή απόκρισης, τους παράγοντες και το είδος των επιδράσεων τους (σταθερές ή τυχαίες). Δώστε κατάλληλο πρότυπο για την περιγραφή του προβλήματος και προσδιορίστε τις υποθέσεις που το διέπουν (τις συνθήκες που πρέπει να ικανοποιούνται). 2 Να κατασκευάσετε τα διαγράμματα των κυρίων επιδράσεων των παραγόντων καθώς και το διάγραμμα αλληλεπίδρασης αυτών. Στη συνέχεια, να ερευνήσετε, μελετώντας τα διαγράμματα, αν υπάρχει κάποια θερμοκρασία μίγματος με την οποία μεγιστοποιείται η δύναμη που πρέπει να εφαρμοστεί ώστε να σπάσει η κόλληση (ανεξάρτητα από τον τύπο της κόλλας που χρησιμοποιείται) ή αν υπάρχει κάποιος τύπος κόλλας η χρήση του οποίου μεγιστοποιεί τη δύναμη που πρέπει να εφαρμοστεί ώστε να σπάσει η κόλληση (ανεξάρτητα από τη θερμοκρασία του μίγματος). 3 Να δώσετε τον πίνακα ανάλυσης διασποράς και να εντοπίσετε, σε επίπεδο σημαντικότητας 1%, τις σημαντικές παραγοντικές επιδράσεις αναφέροντας κάθε φορά ποιά είναι η μηδενική υπόθεση που ελέγχετε. Τέλος, κάνοντας γραφική ανάλυση των υπολοίπων, να ελέγξετε το κατά πόσο μπορεί να θεωρηθεί ότι ισχύουν οι υποθέσεις του προτύπου.
29 Ερώτημα 1 Πρόκειται για παραγοντικό πείραμα δύο σταθερών παραγόντων με τέσσερα επίπεδα ο ένας και τρία επίπεδα ο άλλος και συνολικά 12 θεραπείες. Για κάθε θεραπεία προκύπτει πως έχουν γίνει n = 4 επαναλήψεις, γεγονός που καθιστά το σχεδιασμό ισορροπημένο. Παράγοντες: ο τύπος μίγματος κόλλας (με 4 επίπεδα) και η θερμοκρασία του μίγματος κόλλας (με 3 επίπεδα) Μεταβλητή απόκρισης: η δύναμη που ασκείται κάθετα στον οριζόντιο δοκό μέχρι να «σπάσει» η κόλληση
30 Chi-Square test
31 Goodness-of-fit test a test to determine if a population has a specified theoretical distribution. H 0 : The population has a specified theoretical distribution vs H 1 : The population has NOT the specified theoretical distribution The test is based on how good is the obtained fit between the frequency of occurrence of observations in an observed sample and the expected frequencies obtained from the hypothesized distribution. For example, we consider the tossing of a die. We hypothesize that the die is honest. H 0 : f (x) = 1 6, x = 1,..., 6 vs H 1 : not H 0 : The die is tossed 120 times and each outcome is recorded x observed expected Test at a 5% significant level if the dice is unbiased.
32 The observed frequencies O i Goodness-of-fit test Compute the expected frequencies under the null hypothesis. E i = np i n : the sample size p i : the probability of the value x i. Compute the quantity X 2 = k (O i E i ) 2 i=1 E i X 2 k 1 under H 0 If X 2 > X 2 k 1 α, then H 0 is rejected at α% significant level. The decision criterion described here should not be used unless each of the expected frequencies is greater or equal to 5. χ 2 = (20 20) (22 20) (17 20) (18 20) (19 20) (24 20)2 20 = 1.7 χ 2 5,0.05 = 11.07
33 Goodness-of-fit test Example The level of noise in a village near to a racetrack is rated during a race at a scale of 1-5 from all adult residents of the population. The results of the responses of the people presented in the following table. Noise Level Frequencies At α = 5% significance level, test if there is a difference between the percentage of responses of residents about how they experience the noise level.
34 Goodness-of-fit test Example The Weibull distribution with cumulative distribution function (cdf) F (t) = 1 e (t/β)α, t > 0 contains as a spacial case for α = 2 the Rayleigh distribution which is used to describe the error in the determination of the location of an item by its programmer. When the errors are analyzed in rectangular coordinate systems, they are described by two independent normal distributions with mean 0 and common standard deviation. A company that produces positioning devices, argues that the determination error (in meters) of the location that a new device presents when used in open area follows the Rayleigh distribution and at 50% of cases, the error is less than meters. The following table presents the measurements of determination error (in meters) of the location in a random sample of 66 selected users of the new device. Determining error < >1.1 Frequencies Based on the above data, check the validity of the company s claim.
35 Goodness-of-fit test When the X 2 test is applied to continuous variables, it is influenced by the grouping of the data. So, X 2 goodness of fit test is preferred when we have categorical variables with finite state space. In SpSS, we cannot apply X 2 goodness of fit test to continuous variables. In cases where continuous data is available, Kolmogorov - Smirnov test is preferable where it is based on the empirical cumulative distribution function. The X 2 test can be applied even when the parameters of the population distribution are unknown. In this case the degrees of freedom of the statistical test are reduced according to the number of parameters under estimation. The unknown parameters of the distribution are estimated by the observations and in this case the test statistic has the following form k X 2 (O i = Êi) 2 i=1 Ê i X 2 k 1 r and H 0 is rejected when X 2 > X k 1 r,α
36 Empirical cumulative distribution function Let x 1, x 2,..., x n be a random sample. Kolmogorov - Smirnov test F n (x) = n I (x i x) If the sample is derived from the assumed distribution then the empirical cumulative distribution function should not differ significantly from the theoretical cdf. It holds i=1 P( lim n F n(x) F (x) = 0) = 1, Kolmogorov - Smirnov test is based on the observed differences of F n (x) and F (x). n x
37 Kolmogorov - Smirnov test D + n D n = sup{f n (x) F (x)} = sup{f (x) F n (x)} The test statistic is D = sup{ F n (x) F (x) } = max{d + n, D n } It is based on the maximum observed difference of the theoretical and the empirical cdf.
38 Under H 0, it holds Kolmogorov - Smirnov test P( n D < d) = 1 2 ( 1) k 1 e 2k2 /d 2, 0 d 1 i=1 This is true for any theoretical distribution assumed. H 0 is rejected at significance level a if D > D n,a where D n,a the value of the corresponding table. Kolmogorov - Smirnov test requires the theoretical distribution under the null hypothesis to be fully determined. If the theoretical distribution is not known, its parameters are estimated by the data. But in this case there are no tables to give the critical values so simulations are needed to identify them. Example: Test if the observations given in the file KS1.sav come from the normal distribution.
39 Test of independence The chi-square test can also be used to test the hypothesis of independence of two variables of classification. H 0 The variables A and B are independent H 1 The variables A and B are dependent B 1 B 1 B c A 1 O 11 O 12 O 1c A 2 O 21 O 22 O 2c..... A r O r1 O r2 O rc H 0 The probability in the cell (i, j) is equal to the product of the probabilities to be in the group i of the variable A and in group j of the variable B p ij = p i p j i, j H 1 Not H 0 i.e. p ij p i p j, for at least one (i, j). X 2 = r c i=1 j=1 (O ij E ij ) 2 E ij X 2 (r 1)(c 1)
40 Test of independence Example: The aeronautical aluminum alloy and are often used in the fuselage and wings of the aircraft. During the repair of 250 damages in the fuselage and the wings of aircraft (a) the type of aluminum alloy used to manufacture, and (b) the type of failure were recorded. failure Alloy fatigue corrosion crash Is the type of failure independent of the type of alloy?
41 Test of Homogeneity It can be used to test whether different populations have the same percentage of people with the same characteristic r 2 populations are divided into c 2 groups based on some characteristic and examine if the rate of each group is the same across all populations. H 0 The percentage of each group is the same across all populations H 1 The percentage of at least one group is not the same across all populations
42 Example: Test of Homogeneity A telecommunication company has 5 factories that operate with the same specifications. In order to check the company if there is not any difference in the offered quality between the factories, it got a sample of phones manufactured and submitted to check in order to see how many of them are defective. The collected data are shown in the table below. Factory defective, not defective A B C D 6 74 E Test if the percentage of defective telephones is the same across the five factories.
43 Test for several proportions The chi-square statistic for testing homogeneity is also applicable for testing the hypothesis that k binomial parameters have the same value H 0 : p 1 = p 2 = = p k Samples k successes x 1 x 2... x k failures n 1 x 1 n 2 x 2... n k x k Compute the quantity X 2 = k (o i e i ) 2 i=1 e i X 2 k 1 under H 0 If X 2 > X 2 k 1 α, then H 0 is rejected at α% significance level.

44 Nonparametric Tests
45 Sign Test H 0 : δ X δ Y = 0 vs H 1 : δ X δ Y 0 Test the equality of the medians of two continuous dependent random variables X and Y (paired samples) Or equivalent H 0 p = 0.5 vs H 1 p 0.5 where p = P(X > Y ). Let n n + = I (x i > y i ), n = R = max{n +, n } i=1 n I (x i < y i ) Under H 0, R B(n, 0.5) thus E(R) = n/2 Var(R) = n/4. The probability P(R r) can be computed. i=1 If n is large then under H 0, R N (n/2, n/4) In this case, the test statistic is R n/2 0.5 n/4 N (0.1)
46 Wilcoxon signed-rank test H 0 : δ X δ Y = 0 vs H 1 : δ X δ Y 0 Wilcoxon signed-rank test step by step: 1. Compute the ranks of the absolute differences x i y i ignoring the cases where x i y i = Compute the sums of the ranks S p and S n that correspond to positive and negative differences respectively. 3. If the sample size n is large, then Z = min{s n, S p } n(n+1) 4 L n(n+1)(2n+1) 24 i=1 t 3 i t i 48 N(0.1) under H 0. L the number of cases that we have equal observations and t i the number of observations with the same rank.
47 Wilcoxon signed-rank test H 0 : δ X δ Y = 0 vs H 1 : δ X δ Y 0 Wilcoxon signed-rank test step by step: 1. Compute the ranks of the absolute differences x i y i ignoring the cases where x i y i = Compute the sums of the ranks S p and S n that correspond to positive and negative differences respectively. 3. If the sample size n is large, then Z = min{s n, S p } n(n+1) 4 L n(n+1)(2n+1) 24 i=1 t 3 i t i 48 N(0.1) under H 0. L the number of cases that we have equal observations and t i the number of observations with the same rank.
48 Example Wilcoxon signed-rank test To evaluate the results of the retraining seminar in engineers, 35 engineers were randomly selected and asked to answer a series of questions before and a month after the seminar. The scores are presented in the file entitled seminar.sav. Test if there is a difference in the median performance of engineers before and after participation in the seminar.
49 H 0 : δ X1 = δ X2 = = δ Xk and H 1 not H 0 Kruskal Wallis Test Kruskal Wallis Test step by step 1. Compute the ranks of the observations assuming the k samples as one. 2. Compute the sums of the ranks R i, the number of observations n i in each group and the quantity T i = ti 3 t i in cases where they are observations with the same rank where t i is the number of observations with the same rank. 3. If n i s are large, i.e. n i > 5. H = 12 N(N + 1) k i=1 R 2 i n i 3(N + 1) X 2 k 1 under H 0. In the case that they are observations with the same rank, the above quantity is corrected as follows H = 1 H L ti 2 (t i 1) N 2 (N 1) where L is the number of cases that we have equal observations. i=1
50 Kruskal Wallis Test Example: The file tires.sav displays the results of laboratory measurements of the tread wear indicator (TWI) presenting the tires of three different companies when used under the same conditions. Test, at a significance level of 5%, if there are differences between the tires of the three companies.
51 Randomness test H 0 The sample is random H 1 The sample is not random The random variable is of the form {0, 1} defective or not defective product. component type A or Type B a characteristic above or bellow a value Run Test If the population is expressed by a binary variable then the sample is a run sequence. Definition: In a symbol sequence of at least two types of symbols, run is called a sequence of the same symbol which is blocked by symbols of other type. The number of symbols of the run is called the length of the run. If the random variable is continuous then the sample is a device of real numbers, but it can be converted to a run sequence. A symbol is associated with each sample depending on whether or not it is greater than the median or the mean. Price equal to the median or the average is omitted.
52 Run Test 0, 0, 0, 1, 0, 1, 1, 0,... H 0 The sample is random H 1 The sample is not random If the sample is not random then there are trends expressed with symbol accumulations and either the number of runs is small but their length is large, or there are symbol recycling expressed by systematic variations of symbols and the number of runs is very large. So according to the above we reject the null hypothesis, if the number of runs is very small or very large. Let R 0 and R 1 the number of 0 and 1 runs and n 0 and n 1 the number of the corresponding symbols in the sample. H 0 is rejected at significance level α% if P(R k 1 ) = α/2 or P(R k 2 ) = α/2 where R = R 0 + R 1, k 1 and k 2 the corresponding values in the tables of this test. µ R = E(R) = 2n 0n 1 n 0 + n σ 2 R = Var(R) = 2n 0n 1 (2n 0 n 2 n 0 n 2 ) (n 0 + n 1 ) 2 (n 0 + n 2 1) Z = R µ R σ R N(0, 1)
53 Run Test Example. During a laboratory experiment, the friction coefficient between two metals was measured. The results are presented in the following table The head of the laboratory suspects that measurements shots were not correct and therefore wants to examine whether the measures can be considered random or not. With the help of the median, test if there are significant indications at significance levels a = 0.05% that the measurements can not be considered random.
Μηχανική Μάθηση Hypothesis Testing
 ΕΛΛΗΝΙΚΗ ΔΗΜΟΚΡΑΤΙΑ ΠΑΝΕΠΙΣΤΗΜΙΟ ΚΡΗΤΗΣ Μηχανική Μάθηση Hypothesis Testing Γιώργος Μπορμπουδάκης Τμήμα Επιστήμης Υπολογιστών Procedure 1. Form the null (H 0 ) and alternative (H 1 ) hypothesis 2. Consider
FORMULAS FOR STATISTICS 1
 FORMULAS FOR STATISTICS 1 X = 1 n Sample statistics X i or x = 1 n x i (sample mean) S 2 = 1 n 1 s 2 = 1 n 1 (X i X) 2 = 1 n 1 (x i x) 2 = 1 n 1 Xi 2 n n 1 X 2 x 2 i n n 1 x 2 or (sample variance) E(X)
Statistics 104: Quantitative Methods for Economics Formula and Theorem Review
 Harvard College Statistics 104: Quantitative Methods for Economics Formula and Theorem Review Tommy MacWilliam, 13 tmacwilliam@college.harvard.edu March 10, 2011 Contents 1 Introduction to Data 5 1.1 Sample
5.4 The Poisson Distribution.
 The worst thing you can do about a situation is nothing. Sr. O Shea Jackson 5.4 The Poisson Distribution. Description of the Poisson Distribution Discrete probability distribution. The random variable
Repeated measures Επαναληπτικές μετρήσεις
 ΠΡΟΒΛΗΜΑ Στο αρχείο δεδομένων diavitis.sav καταγράφεται η ποσότητα γλυκόζης στο αίμα 10 ασθενών στην αρχή της χορήγησης μιας θεραπείας, μετά από ένα μήνα και μετά από δύο μήνες. Μελετήστε την επίδραση
Other Test Constructions: Likelihood Ratio & Bayes Tests
 Other Test Constructions: Likelihood Ratio & Bayes Tests Side-Note: So far we have seen a few approaches for creating tests such as Neyman-Pearson Lemma ( most powerful tests of H 0 : θ = θ 0 vs H 1 :
ST5224: Advanced Statistical Theory II
 ST5224: Advanced Statistical Theory II 2014/2015: Semester II Tutorial 7 1. Let X be a sample from a population P and consider testing hypotheses H 0 : P = P 0 versus H 1 : P = P 1, where P j is a known
Biostatistics for Health Sciences Review Sheet
 Biostatistics for Health Sciences Review Sheet http://mathvault.ca June 1, 2017 Contents 1 Descriptive Statistics 2 1.1 Variables.............................................. 2 1.1.1 Qualitative........................................
Μενύχτα, Πιπερίγκου, Σαββάτης. ΒΙΟΣΤΑΤΙΣΤΙΚΗ Εργαστήριο 5 ο
 Κατανομές Στατιστικών Συναρτήσεων Δύο ανεξάρτητα δείγματα από κανονική κατανομή Έστω Χ= ( Χ, Χ,..., Χ ) τ.δ. από Ν( µ, σ ) μεγέθους n και 1 n 1 1 Y = (Y, Y,..., Y ) τ.δ. από Ν( µ, σ ) 1 n 1 Χ Y ( µ µ )
ΕΙΣΑΓΩΓΗ ΣΤΗ ΣΤΑΤΙΣΤΙΚΗ ΑΝΑΛΥΣΗ
 ΕΙΣΑΓΩΓΗ ΣΤΗ ΣΤΑΤΙΣΤΙΚΗ ΑΝΑΛΥΣΗ ΕΛΕΝΑ ΦΛΟΚΑ Επίκουρος Καθηγήτρια Τµήµα Φυσικής, Τοµέας Φυσικής Περιβάλλοντος- Μετεωρολογίας ΓΕΝΙΚΟΙ ΟΡΙΣΜΟΙ Πληθυσµός Σύνολο ατόµων ή αντικειµένων στα οποία αναφέρονται
APPENDICES APPENDIX A. STATISTICAL TABLES AND CHARTS 651 APPENDIX B. BIBLIOGRAPHY 677 APPENDIX C. ANSWERS TO SELECTED EXERCISES 679
 APPENDICES APPENDIX A. STATISTICAL TABLES AND CHARTS 1 Table I Summary of Common Probability Distributions 2 Table II Cumulative Standard Normal Distribution Table III Percentage Points, 2 of the Chi-Squared
χ 2 test ανεξαρτησίας
 χ 2 test ανεξαρτησίας Καθηγητής Ι. Κ. ΔΗΜΗΤΡΙΟΥ demetri@econ.uoa.gr 7.2 Το χ 2 Τεστ Ανεξαρτησίας Tο χ 2 τεστ ανεξαρτησίας (όπως και η παλινδρόμηση) είναι στατιστικά εργαλεία για τον εντοπισμό σχέσεων μεταξύ
ΚΥΠΡΙΑΚΗ ΕΤΑΙΡΕΙΑ ΠΛΗΡΟΦΟΡΙΚΗΣ CYPRUS COMPUTER SOCIETY ΠΑΓΚΥΠΡΙΟΣ ΜΑΘΗΤΙΚΟΣ ΔΙΑΓΩΝΙΣΜΟΣ ΠΛΗΡΟΦΟΡΙΚΗΣ 19/5/2007
 Οδηγίες: Να απαντηθούν όλες οι ερωτήσεις. Αν κάπου κάνετε κάποιες υποθέσεις να αναφερθούν στη σχετική ερώτηση. Όλα τα αρχεία που αναφέρονται στα προβλήματα βρίσκονται στον ίδιο φάκελο με το εκτελέσιμο
Statistical Inference I Locally most powerful tests
 Statistical Inference I Locally most powerful tests Shirsendu Mukherjee Department of Statistics, Asutosh College, Kolkata, India. shirsendu st@yahoo.co.in So far we have treated the testing of one-sided
Math 6 SL Probability Distributions Practice Test Mark Scheme
 Math 6 SL Probability Distributions Practice Test Mark Scheme. (a) Note: Award A for vertical line to right of mean, A for shading to right of their vertical line. AA N (b) evidence of recognizing symmetry
Μαντζούνη, Πιπερίγκου, Χατζή. ΒΙΟΣΤΑΤΙΣΤΙΚΗ Εργαστήριο 5 ο
 Κατανομές Στατιστικών Συναρτήσεων Δύο δείγματα από κανονική κατανομή Έστω Χ= ( Χ, Χ,..., Χ ) τ.δ. από Ν( µ, σ ) μεγέθους n και 1 n 1 1 Y = (Y, Y,...,Y ) τ.δ. από Ν( µ, σ ) 1 n 1 Χ Y ( µ µ ) S σ Τ ( Χ,Y)
Aquinas College. Edexcel Mathematical formulae and statistics tables DO NOT WRITE ON THIS BOOKLET
 Aquinas College Edexcel Mathematical formulae and statistics tables DO NOT WRITE ON THIS BOOKLET Pearson Edexcel Level 3 Advanced Subsidiary and Advanced GCE in Mathematics and Further Mathematics Mathematical
Statistics & Research methods. Athanasios Papaioannou University of Thessaly Dept. of PE & Sport Science
 Statistics & Research methods Athanasios Papaioannou University of Thessaly Dept. of PE & Sport Science 30 25 1,65 20 1,66 15 10 5 1,67 1,68 Κανονική 0 Height 1,69 Καμπύλη Κανονική Διακύμανση & Ζ-scores
Επιστηµονική Επιµέλεια ρ. Γεώργιος Μενεξές. Εργαστήριο Γεωργίας. Viola adorata
 One-way ANOVA µε το SPSS Επιστηµονική Επιµέλεια ρ. Γεώργιος Μενεξές Τοµέας Φυτών Μεγάλης Καλλιέργειας και Οικολογίας, Εργαστήριο Γεωργίας Viola adorata To call in a statistician after the experiment is
CHAPTER 25 SOLVING EQUATIONS BY ITERATIVE METHODS
 CHAPTER 5 SOLVING EQUATIONS BY ITERATIVE METHODS EXERCISE 104 Page 8 1. Find the positive root of the equation x + 3x 5 = 0, correct to 3 significant figures, using the method of bisection. Let f(x) =
Αν οι προϋποθέσεις αυτές δεν ισχύουν, τότε ανατρέχουµε σε µη παραµετρικό τεστ.
 ΣΤ. ΑΝΑΛΥΣΗ ΙΑΣΠΟΡΑΣ (ANALYSIS OF VARIANCE - ANOVA) ΣΤ 1. Ανάλυση ιασποράς κατά µία κατεύθυνση. Όπως έχουµε δει στη παράγραφο Β 2, όταν θέλουµε να ελέγξουµε, αν η µέση τιµή µιας ποσοτικής µεταβλητής διαφέρει
Solution Series 9. i=1 x i and i=1 x i.
 Lecturer: Prof. Dr. Mete SONER Coordinator: Yilin WANG Solution Series 9 Q1. Let α, β >, the p.d.f. of a beta distribution with parameters α and β is { Γ(α+β) Γ(α)Γ(β) f(x α, β) xα 1 (1 x) β 1 for < x
Homework 3 Solutions
 Homework 3 Solutions Igor Yanovsky (Math 151A TA) Problem 1: Compute the absolute error and relative error in approximations of p by p. (Use calculator!) a) p π, p 22/7; b) p π, p 3.141. Solution: For
Για να ελέγξουµε αν η κατανοµή µιας µεταβλητής είναι συµβατή µε την κανονική εφαρµόζουµε το test Kolmogorov-Smirnov.
 A. ΈΛΕΓΧΟΣ ΚΑΝΟΝΙΚΟΤΗΤΑΣ A 1. Έλεγχος κανονικότητας Kolmogorov-Smirnov. Για να ελέγξουµε αν η κατανοµή µιας µεταβλητής είναι συµβατή µε την κανονική εφαρµόζουµε το test Kolmogorov-Smirnov. Μηδενική υπόθεση:
Jesse Maassen and Mark Lundstrom Purdue University November 25, 2013
 Notes on Average Scattering imes and Hall Factors Jesse Maassen and Mar Lundstrom Purdue University November 5, 13 I. Introduction 1 II. Solution of the BE 1 III. Exercises: Woring out average scattering
EE512: Error Control Coding
 EE512: Error Control Coding Solution for Assignment on Finite Fields February 16, 2007 1. (a) Addition and Multiplication tables for GF (5) and GF (7) are shown in Tables 1 and 2. + 0 1 2 3 4 0 0 1 2 3
Econ 2110: Fall 2008 Suggested Solutions to Problem Set 8 questions or comments to Dan Fetter 1
 Eon : Fall 8 Suggested Solutions to Problem Set 8 Email questions or omments to Dan Fetter Problem. Let X be a salar with density f(x, θ) (θx + θ) [ x ] with θ. (a) Find the most powerful level α test
HOMEWORK 4 = G. In order to plot the stress versus the stretch we define a normalized stretch:
 HOMEWORK 4 Problem a For the fast loading case, we want to derive the relationship between P zz and λ z. We know that the nominal stress is expressed as: P zz = ψ λ z where λ z = λ λ z. Therefore, applying
Queensland University of Technology Transport Data Analysis and Modeling Methodologies
 Queensland University of Technology Transport Data Analysis and Modeling Methodologies Lab Session #7 Example 5.2 (with 3SLS Extensions) Seemingly Unrelated Regression Estimation and 3SLS A survey of 206
Section 8.3 Trigonometric Equations
 99 Section 8. Trigonometric Equations Objective 1: Solve Equations Involving One Trigonometric Function. In this section and the next, we will exple how to solving equations involving trigonometric functions.
2. THEORY OF EQUATIONS. PREVIOUS EAMCET Bits.
 EAMCET-. THEORY OF EQUATIONS PREVIOUS EAMCET Bits. Each of the roots of the equation x 6x + 6x 5= are increased by k so that the new transformed equation does not contain term. Then k =... - 4. - Sol.
A Bonus-Malus System as a Markov Set-Chain. Małgorzata Niemiec Warsaw School of Economics Institute of Econometrics
 A Bonus-Malus System as a Markov Set-Chain Małgorzata Niemiec Warsaw School of Economics Institute of Econometrics Contents 1. Markov set-chain 2. Model of bonus-malus system 3. Example 4. Conclusions
2 Composition. Invertible Mappings
 Arkansas Tech University MATH 4033: Elementary Modern Algebra Dr. Marcel B. Finan Composition. Invertible Mappings In this section we discuss two procedures for creating new mappings from old ones, namely,
Απόκριση σε Μοναδιαία Ωστική Δύναμη (Unit Impulse) Απόκριση σε Δυνάμεις Αυθαίρετα Μεταβαλλόμενες με το Χρόνο. Απόστολος Σ.
 Απόκριση σε Δυνάμεις Αυθαίρετα Μεταβαλλόμενες με το Χρόνο. Απόστολος Σ.") Απόκριση σε Δυνάμεις Αυθαίρετα Μεταβαλλόμενες με το Χρόνο The time integral of a force is referred to as impulse, is determined by and is obtained from: Newton s 2 nd Law of motion states that the action
Απόκριση σε Δυνάμεις Αυθαίρετα Μεταβαλλόμενες με το Χρόνο The time integral of a force is referred to as impulse, is determined by and is obtained from: Newton s 2 nd Law of motion states that the action
(Στατιστική Ανάλυση) Δεδομένων I. Σύγκριση δύο πληθυσμών (με το S.P.S.S.)
 Δεδομένων I. Σύγκριση δύο πληθυσμών (με το S.P.S.S.)") (Στατιστική Ανάλυση) Δεδομένων I Σύγκριση δύο πληθυσμών (με το S.P.S.S.) Νίκος Τσάντας Πρόγραμμα Μεταπτυχιακών Σπουδών Τμήμ. Μαθηματικών Μαθηματικά και Σύγχρονες Εφαρμογές Ακαδημαϊκό έτος 2011-12 Πρόκειται
(Στατιστική Ανάλυση) Δεδομένων I Σύγκριση δύο πληθυσμών (με το S.P.S.S.) Νίκος Τσάντας Πρόγραμμα Μεταπτυχιακών Σπουδών Τμήμ. Μαθηματικών Μαθηματικά και Σύγχρονες Εφαρμογές Ακαδημαϊκό έτος 2011-12 Πρόκειται
Strain gauge and rosettes
 Strain gauge and rosettes Introduction A strain gauge is a device which is used to measure strain (deformation) on an object subjected to forces. Strain can be measured using various types of devices classified
Bayesian statistics. DS GA 1002 Probability and Statistics for Data Science.
 Bayesian statistics DS GA 1002 Probability and Statistics for Data Science http://www.cims.nyu.edu/~cfgranda/pages/dsga1002_fall17 Carlos Fernandez-Granda Frequentist vs Bayesian statistics In frequentist
derivation of the Laplacian from rectangular to spherical coordinates
 derivation of the Laplacian from rectangular to spherical coordinates swapnizzle 03-03- :5:43 We begin by recognizing the familiar conversion from rectangular to spherical coordinates (note that φ is used
Έλεγχος ύπαρξης στατιστικά σημαντικών διαφορών μεταξύ δύο εξαρτημένων δειγμάτων, που δεν ακολουθούν την κανονική κατανομή (Wilcoxon test)
") Έλεγχος ύπαρξης στατιστικά σημαντικών διαφορών μεταξύ δύο εξαρτημένων δειγμάτων, που δεν ακολουθούν την κανονική κατανομή (Wilcoxon test) Σε ορισμένες περιπτώσεις απαιτείται ο έλεγχος της ύπαρξης στατιστικά
Έλεγχος ύπαρξης στατιστικά σημαντικών διαφορών μεταξύ δύο εξαρτημένων δειγμάτων, που δεν ακολουθούν την κανονική κατανομή (Wilcoxon test) Σε ορισμένες περιπτώσεις απαιτείται ο έλεγχος της ύπαρξης στατιστικά
ΚΥΠΡΙΑΚΗ ΕΤΑΙΡΕΙΑ ΠΛΗΡΟΦΟΡΙΚΗΣ CYPRUS COMPUTER SOCIETY ΠΑΓΚΥΠΡΙΟΣ ΜΑΘΗΤΙΚΟΣ ΔΙΑΓΩΝΙΣΜΟΣ ΠΛΗΡΟΦΟΡΙΚΗΣ 24/3/2007
 Οδηγίες: Να απαντηθούν όλες οι ερωτήσεις. Όλοι οι αριθμοί που αναφέρονται σε όλα τα ερωτήματα μικρότεροι του 10000 εκτός αν ορίζεται διαφορετικά στη διατύπωση του προβλήματος. Αν κάπου κάνετε κάποιες υποθέσεις
Lecture 34 Bootstrap confidence intervals
 Lecture 34 Bootstrap confidence intervals Confidence Intervals θ: an unknown parameter of interest We want to find limits θ and θ such that Gt = P nˆθ θ t If G 1 1 α is known, then P θ θ = P θ θ = 1 α
6.3 Forecasting ARMA processes
 122 CHAPTER 6. ARMA MODELS 6.3 Forecasting ARMA processes The purpose of forecasting is to predict future values of a TS based on the data collected to the present. In this section we will discuss a linear
Second Order RLC Filters
 ECEN 60 Circuits/Electronics Spring 007-0-07 P. Mathys Second Order RLC Filters RLC Lowpass Filter A passive RLC lowpass filter (LPF) circuit is shown in the following schematic. R L C v O (t) Using phasor
Inverse trigonometric functions & General Solution of Trigonometric Equations. ------------------ ----------------------------- -----------------
 Inverse trigonometric functions & General Solution of Trigonometric Equations. 1. Sin ( ) = a) b) c) d) Ans b. Solution : Method 1. Ans a: 17 > 1 a) is rejected. w.k.t Sin ( sin ) = d is rejected. If sin
Concrete Mathematics Exercises from 30 September 2016
 Concrete Mathematics Exercises from 30 September 2016 Silvio Capobianco Exercise 1.7 Let H(n) = J(n + 1) J(n). Equation (1.8) tells us that H(2n) = 2, and H(2n+1) = J(2n+2) J(2n+1) = (2J(n+1) 1) (2J(n)+1)
Probability and Random Processes (Part II)
") Probability and Random Processes (Part II) 1. If the variance σ x of d(n) = x(n) x(n 1) is one-tenth the variance σ x of a stationary zero-mean discrete-time signal x(n), then the normalized autocorrelation
Probability and Random Processes (Part II) 1. If the variance σ x of d(n) = x(n) x(n 1) is one-tenth the variance σ x of a stationary zero-mean discrete-time signal x(n), then the normalized autocorrelation
HISTOGRAMS AND PERCENTILES What is the 25 th percentile of a histogram? What is the 50 th percentile for the cigarette histogram?
 HISTOGRAMS AND PERCENTILES What is the 25 th percentile of a histogram? The point on the horizontal axis such that of the area under the histogram lies to the left of that point (and to the right) What
The Simply Typed Lambda Calculus
 Type Inference Instead of writing type annotations, can we use an algorithm to infer what the type annotations should be? That depends on the type system. For simple type systems the answer is yes, and
6.1. Dirac Equation. Hamiltonian. Dirac Eq.
 6.1. Dirac Equation Ref: M.Kaku, Quantum Field Theory, Oxford Univ Press (1993) η μν = η μν = diag(1, -1, -1, -1) p 0 = p 0 p = p i = -p i p μ p μ = p 0 p 0 + p i p i = E c 2 - p 2 = (m c) 2 H = c p 2
Ασκήσεις Εξετάσεων. Μεταπτυχιακό Πρόγραμμα Σπουδών στη. Διοίκηση των Επιχειρήσεων
 Ασκήσεις Εξετάσεων Μεταπτυχιακό Πρόγραμμα Σπουδών στη Διοίκηση των Επιχειρήσεων ΑΣΚΗΣΗ 1: Έλεγχος για τη μέση τιμή ενός πληθυσμού Η αντικαπνιστική νομοθεσία υποχρεώνει τους καπνιστές που εργάζονται σε
ΚΥΠΡΙΑΚΗ ΕΤΑΙΡΕΙΑ ΠΛΗΡΟΦΟΡΙΚΗΣ CYPRUS COMPUTER SOCIETY ΠΑΓΚΥΠΡΙΟΣ ΜΑΘΗΤΙΚΟΣ ΔΙΑΓΩΝΙΣΜΟΣ ΠΛΗΡΟΦΟΡΙΚΗΣ 6/5/2006
 Οδηγίες: Να απαντηθούν όλες οι ερωτήσεις. Ολοι οι αριθμοί που αναφέρονται σε όλα τα ερωτήματα είναι μικρότεροι το 1000 εκτός αν ορίζεται διαφορετικά στη διατύπωση του προβλήματος. Διάρκεια: 3,5 ώρες Καλή
C.S. 430 Assignment 6, Sample Solutions
 C.S. 430 Assignment 6, Sample Solutions Paul Liu November 15, 2007 Note that these are sample solutions only; in many cases there were many acceptable answers. 1 Reynolds Problem 10.1 1.1 Normal-order
SOLUTIONS TO MATH38181 EXTREME VALUES AND FINANCIAL RISK EXAM
 SOLUTIONS TO MATH38181 EXTREME VALUES AND FINANCIAL RISK EXAM Solutions to Question 1 a) The cumulative distribution function of T conditional on N n is Pr T t N n) Pr max X 1,..., X N ) t N n) Pr max
the total number of electrons passing through the lamp.
 1. A 12 V 36 W lamp is lit to normal brightness using a 12 V car battery of negligible internal resistance. The lamp is switched on for one hour (3600 s). For the time of 1 hour, calculate (i) the energy
Instruction Execution Times
 1 C Execution Times InThisAppendix... Introduction DL330 Execution Times DL330P Execution Times DL340 Execution Times C-2 Execution Times Introduction Data Registers This appendix contains several tables
4.6 Autoregressive Moving Average Model ARMA(1,1)
") 84 CHAPTER 4. STATIONARY TS MODELS 4.6 Autoregressive Moving Average Model ARMA(,) This section is an introduction to a wide class of models ARMA(p,q) which we will consider in more detail later in this
84 CHAPTER 4. STATIONARY TS MODELS 4.6 Autoregressive Moving Average Model ARMA(,) This section is an introduction to a wide class of models ARMA(p,q) which we will consider in more detail later in this
Phys460.nb Solution for the t-dependent Schrodinger s equation How did we find the solution? (not required)
") Phys460.nb 81 ψ n (t) is still the (same) eigenstate of H But for tdependent H. The answer is NO. 5.5.5. Solution for the tdependent Schrodinger s equation If we assume that at time t 0, the electron starts
Phys460.nb 81 ψ n (t) is still the (same) eigenstate of H But for tdependent H. The answer is NO. 5.5.5. Solution for the tdependent Schrodinger s equation If we assume that at time t 0, the electron starts
Mean bond enthalpy Standard enthalpy of formation Bond N H N N N N H O O O
 Q1. (a) Explain the meaning of the terms mean bond enthalpy and standard enthalpy of formation. Mean bond enthalpy... Standard enthalpy of formation... (5) (b) Some mean bond enthalpies are given below.
TABLES AND FORMULAS FOR MOORE Basic Practice of Statistics
 TABLES AND FORMULAS FOR MOORE Basic Practice of Statistics Exploring Data: Distributions Look for overall pattern (shape, center, spread) and deviations (outliers). Mean (use a calculator): x = x 1 + x
Matrices and Determinants
 Matrices and Determinants SUBJECTIVE PROBLEMS: Q 1. For what value of k do the following system of equations possess a non-trivial (i.e., not all zero) solution over the set of rationals Q? x + ky + 3z
Παράδειγμα: Γούργουλης Βασίλειος, Επίκουρος Καθηγητής Τ.Ε.Φ.Α.Α.-Δ.Π.Θ.
 Έλεγχος ύπαρξης στατιστικά σημαντικών διαφορών μεταξύ περισσότερων από δύο δειγμάτων, που διαχωρίζονται βάσει δύο ανεξάρτητων παραγόντων (Ανάλυση διακύμανσης για ανεξάρτητα δείγματα ως προς περισσότερους
Example Sheet 3 Solutions
 Example Sheet 3 Solutions. i Regular Sturm-Liouville. ii Singular Sturm-Liouville mixed boundary conditions. iii Not Sturm-Liouville ODE is not in Sturm-Liouville form. iv Regular Sturm-Liouville note
ΚΟΙΝΩΝΙΟΒΙΟΛΟΓΙΑ, ΝΕΥΡΟΕΠΙΣΤΗΜΕΣ ΚΑΙ ΕΚΠΑΙΔΕΥΣΗ
 A εξάμηνο 2009-2010 ΠΡΟΓΡΑΜΜΑ ΜΕΤΑΠΤΥΧΙΑΚΩΝ ΣΠΟΥΔΩΝ ΚΟΙΝΩΝΙΟΒΙΟΛΟΓΙΑ, ΝΕΥΡΟΕΠΙΣΤΗΜΕΣ ΚΑΙ ΕΚΠΑΙΔΕΥΣΗ Μεθοδολογία Έρευνας και Στατιστική ΑΝΤΩΝΙΟΣ ΧΡ. ΜΠΟΥΡΑΣ Χειμερινό Εξάμηνο 2009-2010 Ποιοτικές και Ποσοτικές
ΑΥΤΟΜΑΤΟΠΟΙΗΜΕΝΗ ΣΤΑΤΙΣΤΙΚΗ ΑΝΑΛΥΣΗ
 Ελληνικό Στατιστικό Ινστιτούτο Πρακτικά 21 ου Πανελληνίου Συνεδρίου Στατιστικής (2008), σελ 267-274 ΑΥΤΟΜΑΤΟΠΟΙΗΜΕΝΗ ΣΤΑΤΙΣΤΙΚΗ ΑΝΑΛΥΣΗ Β. Παππάς 1, Κ. Ξ. Καρακώστας 2 Τμήμα Μαθηματικών, Πανεπιστήμιο Ιωαννίνων
SCHOOL OF MATHEMATICAL SCIENCES G11LMA Linear Mathematics Examination Solutions
 SCHOOL OF MATHEMATICAL SCIENCES GLMA Linear Mathematics 00- Examination Solutions. (a) i. ( + 5i)( i) = (6 + 5) + (5 )i = + i. Real part is, imaginary part is. (b) ii. + 5i i ( + 5i)( + i) = ( i)( + i)
519.22(07.07) 78 : ( ) /.. ; c (07.07) , , 2008
 78 : ( ) /.. ; c (07.07) , , 2008") .. ( ) 2008 519.22(07.07) 78 : ( ) /.. ;. : -, 2008. 38 c. ( ) STATISTICA.,. STATISTICA.,. 519.22(07.07),.., 2008.., 2008., 2008 2 ... 4 1...5...5 2...14...14 3...27...27 3 ,, -. " ", :,,,... STATISTICA.,,,.
.. ( ) 2008 519.22(07.07) 78 : ( ) /.. ;. : -, 2008. 38 c. ( ) STATISTICA.,. STATISTICA.,. 519.22(07.07),.., 2008.., 2008., 2008 2 ... 4 1...5...5 2...14...14 3...27...27 3 ,, -. " ", :,,,... STATISTICA.,,,.
ΑΝΑΛΥΣΗ ΔΕΔΟΜΕΝΩΝ. Δρ. Βασίλης Π. Αγγελίδης Τμήμα Μηχανικών Παραγωγής & Διοίκησης Δημοκρίτειο Πανεπιστήμιο Θράκης
 ΑΝΑΛΥΣΗ ΔΕΔΟΜΕΝΩΝ Δρ. Βασίλης Π. Αγγελίδης Τμήμα Μηχανικών Παραγωγής & Διοίκησης Δημοκρίτειο Πανεπιστήμιο Θράκης Άσκηση 1 η Ένας παραγωγός σταφυλιών ισχυρίζεται ότι τα κιβώτια σταφυλιών που συσκευάζει
Chapter 6: Systems of Linear Differential. be continuous functions on the interval
 Chapter 6: Systems of Linear Differential Equations Let a (t), a 2 (t),..., a nn (t), b (t), b 2 (t),..., b n (t) be continuous functions on the interval I. The system of n first-order differential equations
Potential Dividers. 46 minutes. 46 marks. Page 1 of 11
 Potential Dividers 46 minutes 46 marks Page 1 of 11 Q1. In the circuit shown in the figure below, the battery, of negligible internal resistance, has an emf of 30 V. The pd across the lamp is 6.0 V and
An Introduction to Signal Detection and Estimation - Second Edition Chapter II: Selected Solutions
 An Introduction to Signal Detection Estimation - Second Edition Chapter II: Selected Solutions H V Poor Princeton University March 16, 5 Exercise : The likelihood ratio is given by L(y) (y +1), y 1 a With
Every set of first-order formulas is equivalent to an independent set
 Every set of first-order formulas is equivalent to an independent set May 6, 2008 Abstract A set of first-order formulas, whatever the cardinality of the set of symbols, is equivalent to an independent
Numerical Analysis FMN011
 Numerical Analysis FMN011 Carmen Arévalo Lund University carmen@maths.lth.se Lecture 12 Periodic data A function g has period P if g(x + P ) = g(x) Model: Trigonometric polynomial of order M T M (x) =
Finite Field Problems: Solutions
 Finite Field Problems: Solutions 1. Let f = x 2 +1 Z 11 [x] and let F = Z 11 [x]/(f), a field. Let Solution: F =11 2 = 121, so F = 121 1 = 120. The possible orders are the divisors of 120. Solution: The
Δεδομένα (data) και Στατιστική (Statistics)
 και Στατιστική (Statistics)") Δεδομένα (data) και Στατιστική (Statistics) Η Στατιστική (Statistics) ασχολείται με την ανάλυση δεδομένων (data analysis): Πρόσφατες παιδαγωγικές εξελίξεις υποδεικνύουν ότι η Στατιστική πρέπει και να διδάσκεται
Δεδομένα (data) και Στατιστική (Statistics) Η Στατιστική (Statistics) ασχολείται με την ανάλυση δεδομένων (data analysis): Πρόσφατες παιδαγωγικές εξελίξεις υποδεικνύουν ότι η Στατιστική πρέπει και να διδάσκεται
Supplementary Appendix
 Supplementary Appendix Measuring crisis risk using conditional copulas: An empirical analysis of the 2008 shipping crisis Sebastian Opitz, Henry Seidel and Alexander Szimayer Model specification Table
Παράδειγμα: Γούργουλης Βασίλειος, Επίκουρος Καθηγητής Τ.Ε.Φ.Α.Α.-Δ.Π.Θ.
 Έλεγχος ύπαρξης στατιστικά σημαντικών διαφορών μεταξύ δειγμάτων, που διαχωρίζονται βάσει ενός επαναλαμβανόμενου και ενός ανεξάρτητου παράγοντα (Ανάλυση διακύμανσης για εξαρτημένα δείγματα ως προς δύο παράγοντες,
PENGARUHKEPEMIMPINANINSTRUKSIONAL KEPALASEKOLAHDAN MOTIVASI BERPRESTASI GURU TERHADAP KINERJA MENGAJAR GURU SD NEGERI DI KOTA SUKABUMI
 155 Lampiran 6 Yayan Sumaryana, 2014 PENGARUHKEPEMIMPINANINSTRUKSIONAL KEPALASEKOLAHDAN MOTIVASI BERPRESTASI GURU TERHADAP KINERJA MENGAJAR GURU SD NEGERI DI KOTA SUKABUMI Universitas Pendidikan Indonesia
k A = [k, k]( )[a 1, a 2 ] = [ka 1,ka 2 ] 4For the division of two intervals of confidence in R +
[a 1, a 2 ] = [ka 1,ka 2 ] 4For the division of two intervals of confidence in R +](/thumbs/73/69566903.jpg "k A = [k, k]( )[a 1, a 2 ] = [ka 1,ka 2 ] 4For the division of two intervals of confidence in R +") Chapter 3. Fuzzy Arithmetic 3- Fuzzy arithmetic: ~Addition(+) and subtraction (-): Let A = [a and B = [b, b in R If x [a and y [b, b than x+y [a +b +b Symbolically,we write A(+)B = [a (+)[b, b = [a +b
Chapter 3. Fuzzy Arithmetic 3- Fuzzy arithmetic: ~Addition(+) and subtraction (-): Let A = [a and B = [b, b in R If x [a and y [b, b than x+y [a +b +b Symbolically,we write A(+)B = [a (+)[b, b = [a +b
Second Order Partial Differential Equations
 Chapter 7 Second Order Partial Differential Equations 7.1 Introduction A second order linear PDE in two independent variables (x, y Ω can be written as A(x, y u x + B(x, y u xy + C(x, y u u u + D(x, y
The challenges of non-stable predicates
 The challenges of non-stable predicates Consider a non-stable predicate Φ encoding, say, a safety property. We want to determine whether Φ holds for our program. The challenges of non-stable predicates
Correction Table for an Alcoholometer Calibrated at 20 o C
 An alcoholometer is a device that measures the concentration of ethanol in a water-ethanol mixture (often in units of %abv percent alcohol by volume). The depth to which an alcoholometer sinks in a water-ethanol
ΕΛΛΗΝΙΚΗ ΔΗΜΟΚΡΑΤΙΑ ΠΑΝΕΠΙΣΤΗΜΙΟ ΚΡΗΤΗΣ. Ψηφιακή Οικονομία. Διάλεξη 7η: Consumer Behavior Mαρίνα Μπιτσάκη Τμήμα Επιστήμης Υπολογιστών
 ΕΛΛΗΝΙΚΗ ΔΗΜΟΚΡΑΤΙΑ ΠΑΝΕΠΙΣΤΗΜΙΟ ΚΡΗΤΗΣ Ψηφιακή Οικονομία Διάλεξη 7η: Consumer Behavior Mαρίνα Μπιτσάκη Τμήμα Επιστήμης Υπολογιστών Τέλος Ενότητας Χρηματοδότηση Το παρόν εκπαιδευτικό υλικό έχει αναπτυχθεί
ο),,),--,ο< $ι ιι!η ι ηι ι ιι ιι t (t-test): ι ι η ι ι. $ι ι η ι ι ι 2 x s ι ι η η ιη ι η η SE x
,,),--,ο< $ι ιι!η ι ηι ι ιι ιι t (t-test): ι ι η ι ι. $ι ι η ι ι ι 2 x s ι ι η η ιη ι η η SE x") η &, ε ε 007!# # # ι, ι, η ιι ι ι ι ι η (.. ι, η ι η, ι & ι!ι η 50, ι ηιη 000 ι, ι, ',!,! )!η. (, ηι, ι ι ι ι "!η. #, ι "ι!η ι, ηι, ι ι ι η. ι, ι ι, ' ι ι ι η ι ι ι ι # ι ι ι ι ι 7. ο),,),--,ο< $ι ιι!η
η &, ε ε 007!# # # ι, ι, η ιι ι ι ι ι η (.. ι, η ι η, ι & ι!ι η 50, ι ηιη 000 ι, ι, ',!,! )!η. (, ηι, ι ι ι ι "!η. #, ι "ι!η ι, ηι, ι ι ι η. ι, ι ι, ' ι ι ι η ι ι ι ι # ι ι ι ι ι 7. ο),,),--,ο< $ι ιι!η
Quadratic Expressions
 Quadratic Expressions. The standard form of a quadratic equation is ax + bx + c = 0 where a, b, c R and a 0. The roots of ax + bx + c = 0 are b ± b a 4ac. 3. For the equation ax +bx+c = 0, sum of the roots
ΚΥΠΡΙΑΚΟΣ ΣΥΝΔΕΣΜΟΣ ΠΛΗΡΟΦΟΡΙΚΗΣ CYPRUS COMPUTER SOCIETY 21 ος ΠΑΓΚΥΠΡΙΟΣ ΜΑΘΗΤΙΚΟΣ ΔΙΑΓΩΝΙΣΜΟΣ ΠΛΗΡΟΦΟΡΙΚΗΣ Δεύτερος Γύρος - 30 Μαρτίου 2011
 Διάρκεια Διαγωνισμού: 3 ώρες Απαντήστε όλες τις ερωτήσεις Μέγιστο Βάρος (20 Μονάδες) Δίνεται ένα σύνολο από N σφαιρίδια τα οποία δεν έχουν όλα το ίδιο βάρος μεταξύ τους και ένα κουτί που αντέχει μέχρι
Ordinal Arithmetic: Addition, Multiplication, Exponentiation and Limit
 Ordinal Arithmetic: Addition, Multiplication, Exponentiation and Limit Ting Zhang Stanford May 11, 2001 Stanford, 5/11/2001 1 Outline Ordinal Classification Ordinal Addition Ordinal Multiplication Ordinal
6. MAXIMUM LIKELIHOOD ESTIMATION
 6 MAXIMUM LIKELIHOOD ESIMAION [1] Maximum Likelihood Estimator (1) Cases in which θ (unknown parameter) is scalar Notational Clarification: From now on, we denote the true value of θ as θ o hen, view θ
Congruence Classes of Invertible Matrices of Order 3 over F 2
 International Journal of Algebra, Vol. 8, 24, no. 5, 239-246 HIKARI Ltd, www.m-hikari.com http://dx.doi.org/.2988/ija.24.422 Congruence Classes of Invertible Matrices of Order 3 over F 2 Ligong An and
Problem Set 3: Solutions
 CMPSCI 69GG Applied Information Theory Fall 006 Problem Set 3: Solutions. [Cover and Thomas 7.] a Define the following notation, C I p xx; Y max X; Y C I p xx; Ỹ max I X; Ỹ We would like to show that C
Chapter 6: Systems of Linear Differential. be continuous functions on the interval
 Chapter 6: Systems of Linear Differential Equations Let a (t), a 2 (t),..., a nn (t), b (t), b 2 (t),..., b n (t) be continuous functions on the interval I. The system of n first-order differential equations
Fourier Series. MATH 211, Calculus II. J. Robert Buchanan. Spring Department of Mathematics
 Fourier Series MATH 211, Calculus II J. Robert Buchanan Department of Mathematics Spring 2018 Introduction Not all functions can be represented by Taylor series. f (k) (c) A Taylor series f (x) = (x c)
Approximation of distance between locations on earth given by latitude and longitude
 Approximation of distance between locations on earth given by latitude and longitude Jan Behrens 2012-12-31 In this paper we shall provide a method to approximate distances between two points on earth
 22 .5 Real consumption.5 Real residential investment.5.5.5 965 975 985 995 25.5 965 975 985 995 25.5 Real house prices.5 Real fixed investment.5.5.5 965 975 985 995 25.5 965 975 985 995 25.3 Inflation
CE 530 Molecular Simulation
 C 53 olecular Siulation Lecture Histogra Reweighting ethods David. Kofke Departent of Cheical ngineering SUNY uffalo kofke@eng.buffalo.edu Histogra Reweighting ethod to cobine results taken at different
ΚΥΠΡΙΑΚΗ ΕΤΑΙΡΕΙΑ ΠΛΗΡΟΦΟΡΙΚΗΣ CYPRUS COMPUTER SOCIETY ΠΑΓΚΥΠΡΙΟΣ ΜΑΘΗΤΙΚΟΣ ΔΙΑΓΩΝΙΣΜΟΣ ΠΛΗΡΟΦΟΡΙΚΗΣ 11/3/2006
 ΠΑΓΚΥΠΡΙΟΣ ΜΑΘΗΤΙΚΟΣ ΔΙΑΓΩΝΙΣΜΟΣ ΠΛΗΡΟΦΟΡΙΚΗΣ 11/3/26 Οδηγίες: Να απαντηθούν όλες οι ερωτήσεις. Ολοι οι αριθμοί που αναφέρονται σε όλα τα ερωτήματα μικρότεροι το 1 εκτός αν ορίζεται διαφορετικά στη διατύπωση
[1] P Q. Fig. 3.1
![[1] P Q. Fig. 3.1](/thumbs/79/80362156.jpg "[1] P Q. Fig. 3.1") 1 (a) Define resistance....... [1] (b) The smallest conductor within a computer processing chip can be represented as a rectangular block that is one atom high, four atoms wide and twenty atoms long. One
1 (a) Define resistance....... [1] (b) The smallest conductor within a computer processing chip can be represented as a rectangular block that is one atom high, four atoms wide and twenty atoms long. One
Math221: HW# 1 solutions
 Math: HW# solutions Andy Royston October, 5 7.5.7, 3 rd Ed. We have a n = b n = a = fxdx = xdx =, x cos nxdx = x sin nx n sin nxdx n = cos nx n = n n, x sin nxdx = x cos nx n + cos nxdx n cos n = + sin
Physical DB Design. B-Trees Index files can become quite large for large main files Indices on index files are possible.
 B-Trees Index files can become quite large for large main files Indices on index files are possible 3 rd -level index 2 nd -level index 1 st -level index Main file 1 The 1 st -level index consists of pairs
Areas and Lengths in Polar Coordinates
 Kiryl Tsishchanka Areas and Lengths in Polar Coordinates In this section we develop the formula for the area of a region whose boundary is given by a polar equation. We need to use the formula for the
3.4 SUM AND DIFFERENCE FORMULAS. NOTE: cos(α+β) cos α + cos β cos(α-β) cos α -cos β
 cos α + cos β cos(α-β) cos α -cos β") 3.4 SUM AND DIFFERENCE FORMULAS Page Theorem cos(αβ cos α cos β -sin α cos(α-β cos α cos β sin α NOTE: cos(αβ cos α cos β cos(α-β cos α -cos β Proof of cos(α-β cos α cos β sin α Let s use a unit circle
3.4 SUM AND DIFFERENCE FORMULAS Page Theorem cos(αβ cos α cos β -sin α cos(α-β cos α cos β sin α NOTE: cos(αβ cos α cos β cos(α-β cos α -cos β Proof of cos(α-β cos α cos β sin α Let s use a unit circle