DATA MINING LECTURE 6. Mixture of Gaussians and the EM algorithm DBSCAN: A Density-Based Clustering Algorithm Clustering Validation
|
|
|
- Κασσιέπεια Φωτόπουλος
- 9 χρόνια πριν
- Προβολές:
Transcript
1 DATA MINING LECTURE 6 Mixture of Gaussians and the EM algorithm DBSCAN: A Density-Based Clustering Algorithm Clustering Validation

2 Ανακοινώσεις Η προθεσμία για τη παράδοση των θεωρητικών ασκήσεων είναι Τετάρτη 4/4 Καθυστερημένες ασκήσεις σε μετέπειτα ημέρες θα πρέπει να παραδοθούν στην κα. Σουλίου, η οποία θα σημειώνει την ημέρα παράδοσης (Πέμπτη-Παρασκευή μέχρι τις 2:30, ή κάτω από την πόρτα μετά). Μπορείτε να τις παραδώσετε και ηλεκτρονικά αν θέλετε. WEKA: Αν σας βγάλει out-of-memory error, ακολουθείστε τις οδηγίες και αλλάξτε το.ini αρχείο. Θα σας πει ότι δεν επιτρέπεται, οπότε πρέπει να το αντιγράψετε αλλού να το αλλάξετε και μετά να το αντιγράψετε ξανά. LSH Implementation: Για την υλοποίηση θα χρειαστείτε μια υλοποίηση ενός Dictionary και List. Η C++ έχει μια βιβλιοθήκη (STL), και η Java τα έχει ως built-in data types.

3 ΣΥΝΤΟΜΟ ΜΑΘΗΜΑ ΓΙΑ HASH TABLE IMPLEMENTATIONS

4 Vector, map Container vector map Χαρακτηριστικά Δυναμικός πίνακας Κρατάει ζεύγη κλειδιών και τιμών (key-value pairs). Συσχετίζει αντικείμενα-κλειδιά με αντικείμενα-τιμές. Το κάθε κλειδί μπορεί να συσχετίζεται με μόνο μία τιμή

5 vector Μέθοδος size() push_back() pop_back() back() operator [] empty() insert() erase() Λειτουργία επιστρέφει τον αριθμό των στοιχείων μέσα στον πίνακα προσθέτει ένα στοιχείο στο τέλος του πίνακα αφαιρεί το τελευταίο στοιχείο του πίνακα επιστρέφει το τελευταίο στοιχείο του πίνακα τυχαία πρόσβαση στα στοιχεία του πίνακα επιστρέφει true αν το vector είναι άδειο προσθέτει ένα στοιχείο σε ενδιάμεση θέση (χρησιμοποιώντας iterator) αφαιρεί ένα στοιχείο από ενδιάμεση θέση (χρησιμοποιώντας iterator)
 αφαιρεί ένα στοιχείο από ενδιάμεση θέση (χρησιμοποιώντας")
6 Παράδειγμα #include <iostream> #include <vector> using namespace std; int main(){ vector<int> v; int x; do{ cin >> x; v.push_back(x); }while (x!= -1); v[v.size() - 1] = 0; } cout << "vector elements: "; for (int i = 0; i < v.size(); i ++){ cout << v[i] << " "; } cout << endl;
 - 1] = 0; } cout << \"vector elements: \"; for (int i = 0; i <")
7 Παραδειγμα map #include <iostream> #include <map> using namespace std; int main(){ map<string,person*> M; string fname,lname; while (!cin.eof()){ cin >> fname >> lname; Person *p =new Person(fname,lname); M[lname] = p; } } map<string,person*>::iterator iter = M.find( marley"); if (iter == M.end()){ cout << marley is not in\n"; }else{ M[ marley"]->printpersonaldetails(); }
![eof()){ cin >> fname >> lname; Person *p =new Person(fname,lname); M[lname] = p; } }](/docs-images/45/8424936/images/page_7.jpg "map<string,person*>::iterator iter = M.find( marley\"); if (iter == M.")
8 Iterators map #include <iostream> #include <map> using namespace std; int main(){ map<string,person*> M; string fname,lname; (*iter).first: Το κλειδί του map στη θέση στην οποία δείχνει ο iterator (*iter).second: Η τιμή του map στη θέση στην οποία δείχνει ο iterator while (!cin.eof()){ cin >> fname >> lname; Person *p =new Person(fname,lname); M[lname] = p; } } map<string,person*>::iterator iter; for (iter = M.begin(); iter!= M.end(); i++){ cout << (*iter).first << : ; (*iter).second->printpersonaldetails(); }
){ cin >> fname >> lname; Person *p =new Person(fname,lname); M[lname] = p; } } map<string,person*>::iterator iter; for")
9 ArrayList O Container ArrayList κληρονομει από το List και αυτό από το Collection. Προσφέρει σειριακή αποθήκευση δεδομένων και έχει όλα τα πλεονεκτήματα και μειονεκτήματα του vector στην C++. Στην Java δεν επιτρέπεται υπερφόρτωση τελεστών οπότε χρησιμοποιούμε την μέθοδο get(index) για να διαβάσουμε ένα στοιχείο. Διάσχιση του ArrayList με την foreach εντολή είναι πιο απλή απ ότι με τον iterator.
 για να")
10 import java.io.*; import java.util.*; public class arraylist { public static void main(string[] args) { ArrayList<Integer> A = new ArrayList<Integer>(); for (int i = 0; i < 10; i ++){ Random r = new Random(); A.add(r.nextInt(100)); System.out.println(A.get(i)); } Collections.sort(A); System.out.println(""); for (int x: A){ System.out.println(x); } System.out.println(""); System.out.println(A.toString()); } }
); System.out.println(A.get(i)); } Collections.sort(A); System.out.println(\"\"); for (int x: A){ System.")
11 HashMap To HashMap ορίζει ένα συνειρμικό αποθηκευτή (associative container) ο οποίος συσχετίζει κλειδιά με τιμές, κληρονομεί από την πιο γενική κλάση Map. Π.χ., ο βαθμός ενός φοιτητή, η συχνότητα με την οποία εμφανίζεται μια λέξη σε ένα κείμενο. H βιβλιοθήκη της Java μας δίνει πιο εύκολη πρόσβαση στα κλειδιά και τις τιμές του map. Χρήσιμες μέθοδοι: put(key,value): προσθέτει ένα νέο key-value ζεύγος containskey(key): επιστρέφει αληθές αν υπάρχει το κλειδί containsvalue(value): επιστρέφει αληθές αν υπάρχει η τιμή values(): επιστρέφει ένα Collection με τις τιμές keyset(): επιστρέφει ένα Set με τις τιμές.
: προσθέτει ένα νέο key-value ζεύγος containskey(key): επιστρέφει αληθές αν υπάρχει το κλειδί containsvalue(value):")
12 import java.io.*; import java.util.*; public class mapexample { public static void main(string[] args) { String line; Map<String,Integer> namesgrades = new HashMap<String,Integer>(); try{ FileReader fr = new FileReader("Files/in.txt"); BufferedReader inreader = new BufferedReader(fr); } } while((line = inreader.readline())!=null){ System.out.println(line); String [] words = line.split("\t"); Integer grade = Integer.parseInt(words[1]); namesgrades.put(words[0],grade); } } catch(ioexception ex){ System.out.println("IO Error" + ex); } for(string x: namesgrades.keyset()){ System.out.println(x + " -- " + namesgrades.get(x)); }
; String [] words = line.split(\"\t\"); Integer grade = Integer.parseInt(words[1]); namesgrades.")
13 MIXTURE MODELS AND THE EM ALGORITHM

14 Model-based clustering In order to understand our data, we will assume that there is a generative process (a model) that creates/describes the data, and we will try to find the model that best fits the data. Models of different complexity can be defined, but we will assume that our model is a distribution from which data points are sampled Example: the data is the height of all people in Greece In most cases, a single distribution is not good enough to describe all data points: different parts of the data follow a different distribution Example: the data is the height of all people in Greece and China We need a mixture model Different distributions correspond to different clusters in the data.

15 Gaussian Distribution Example: the data is the height of all people in Greece Experience has shown that this data follows a Gaussian (Normal) distribution Reminder: Normal distribution: P x = 1 2πσ e μ = mean, σ = standard deviation x μ 2 2σ 2

16 Gaussian Model What is a model? A Gaussian distribution is fully defined by the mean μ and the standard deviation σ We define our model as the pair of parameters θ = (μ, σ) This is a general principle: a model is defined as a vector of parameters θ
 This is a general principle: a model is")
17 Fitting the model We want to find the normal distribution that best fits our data Find the best values for μ and σ But what does best fit mean?

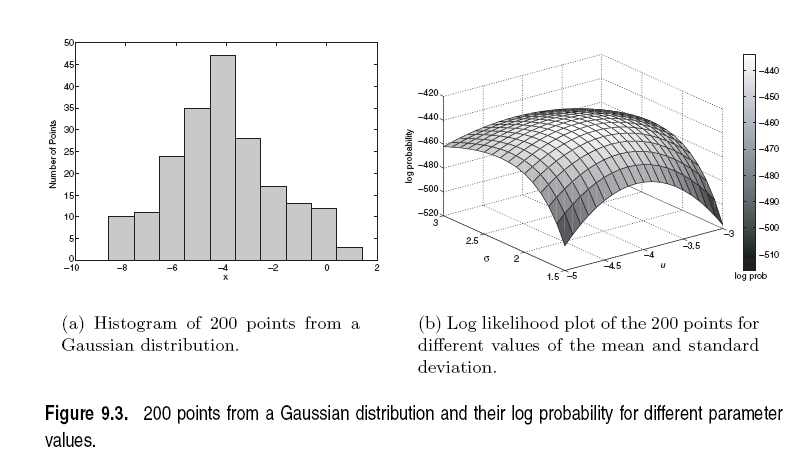
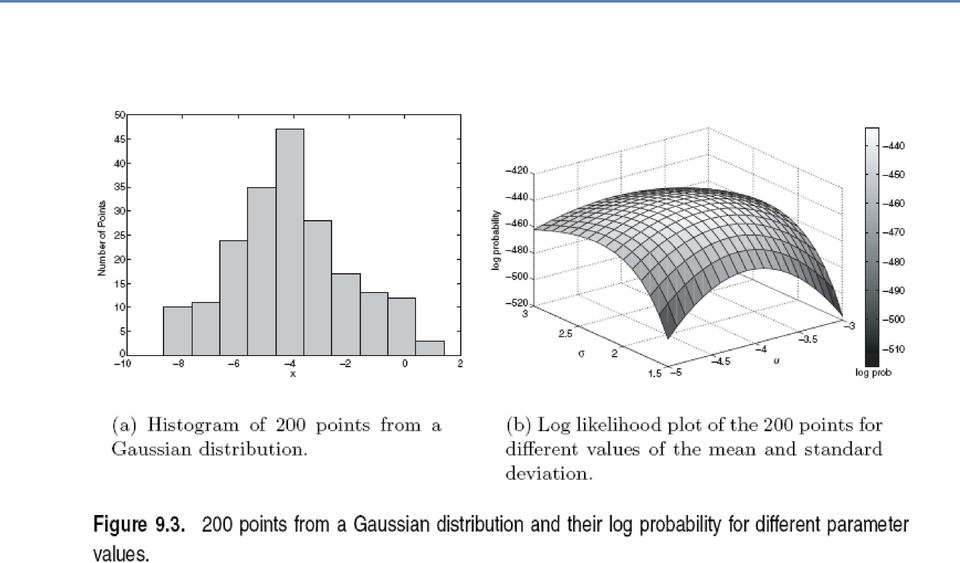
18 Maximum Likelihood Estimation (MLE) Suppose that we have a vector X = (x 1,, x n ) of values And we want to fit a Gaussian N(μ, σ) model to the data Probability of observing point x i : P x i = 1 2πσ e Probability of observing all points (assume independence) n P X = P x i i=1 = x i μ 2 2σ 2 1 2πσ e x i μ 2 2σ 2 We want to find the parameters θ = (μ, σ) that maximize the probability P(X θ) n i=1
 that maximize the probability P(X θ) n i=1")
19 Maximum Likelihood Estimation (MLE) The probability P(X θ) as a function of θ is called the Likelihood function L(θ) = 1 2πσ e It is usually easier to work with the Log-Likelihood function Maximum Likelihood Estimation x i μ 2 2σ 2 Find parameters μ, σ that maximize LL(θ) μ = 1 n n i=1 x i = μ X LL θ = n i=1 n i=1 Sample Mean x i μ 2 2σ 2 σ 2 = 1 n 1 n log 2π n log σ 2 n i=1 (x i μ) 2 = σ X 2 Sample Variance
 2 = σ X 2 Sample")
20
21 Mixture of Gaussians Suppose that you have the heights of people from Greece and China and the distribution looks like the figure below (dramatization)
22 Mixture of Gaussians In this case the data is the result of the mixture of two Gaussians One for Greek people, and one for Chinese people Identifying for each value which Gaussian is most likely to have generated it will give us a clustering.
23 Mixture model A value x i is generated according to the following process: First I select the nationality With probability π G I select Greek, with probability π C I select China (π G + π C = 1) Given the nationality, I generate the point from the corresponding Gaussian P x i θ G ~ N μ G, σ G if Greece P x i θ G ~ N μ G, σ G if China
24 Mixture Model For value x i, we have: P x i = π G P x i θ G + π C P(x i θ C ) For all values X = x 1,, x n n P X = P(x i ) i=1 Our model has the following parameters Θ = (π G, π C, μ G, μ C, σ G, σ C ) Mixture probabilities Distribution Parameters We want to estimate the parameters that maximize the Likelihood of the data
25 Mixture Models Once we have the parameters Θ = (π G, π C, μ G, μ C, σ G, σ C ) we can estimate the membership probabilities P G x i and P C x i for each point x i : This is the probability that point x i belongs to the Greek or the Chinese population (cluster) P G x i = = P x i G P(G) P x i G P G + P x i C P(C) P x i G π G P x i G π G + P x i C π C
26 EM (Expectation Maximization) Algorithm Initialize the values of the parameters in Θ to some random values Repeat until convergence E-Step: Given the parameters Θ estimate the membership probabilities P G x i and P C x i M-Step: Compute the parameter values that (in expectation) maximize the data likelihood π G = 1 n μ C = σ C 2 = n i=1 n i=1 n i=1 P(G x i ) P C x i n π C x i P C x i n π C x i μ C 2 π C = 1 n μ G = σ G 2 = n i=1 n i=1 n i=1 P(C x i ) P G x i n π G x i P G x i n π G x i μ G 2 MLE Estimates if π s were fixed
27 Relationship to K-means E-Step: Assignment of points to clusters K-means: hard assignment, EM: soft assignment M-Step: Computation of centroids K-means assumes common fixed variance (spherical clusters) EM: can change the variance for different clusters or different dimensions (elipsoid clusters) If the variance is fixed then both minimize the same error function
28
29
30
31 DBSCAN: A DENSITY-BASED CLUSTERING ALGORITHM Thanks to: Introduction to Data Mining by Tan, Steinbach, Kumar.
32 DBSCAN: Density-Based Clustering DBSCAN is a Density-Based Clustering algorithm Reminder: In density based clustering we partition points into dense regions separated by not-so-dense regions. Important Questions: How do we measure density? What is a dense region? DBSCAN: Density at point p: number of points within a circle of radius Eps Dense Region: A circle of radius Eps that contains at least MinPts points
33 DBSCAN Characterization of points A point is a core point if it has more than a specified number of points (MinPts) within Eps These points belong in a dense region and are at the interior of a cluster A border point has fewer than MinPts within Eps, but is in the neighborhood of a core point. A noise point is any point that is not a core point or a border point.
34 DBSCAN: Core, Border, and Noise Points

35 DBSCAN: Core, Border and Noise Points Original Points Point types: core, border and noise Eps = 10, MinPts = 4
36 Density-Connected points Density edge We place an edge between two core points q and p if they are within distance Eps. q p 1 p Density-connected A point p is density-connected to a point q if there is a path of edges from p to q p q o
37 DBSCAN Algorithm Label points as core, border and noise Eliminate noise points For every core point p that has not been assigned to a cluster Create a new cluster with the point p and all the points that are density-connected to p. Assign border points to the cluster of the closest core point.
38 DBSCAN: Determining Eps and MinPts Idea is that for points in a cluster, their k th nearest neighbors are at roughly the same distance Noise points have the k th nearest neighbor at farther distance So, plot sorted distance of every point to its k th nearest neighbor Find the distance d where there is a knee in the curve Eps = d, MinPts = k Eps ~ 7-10 MinPts = 4

39 When DBSCAN Works Well Original Points Clusters Resistant to Noise Can handle clusters of different shapes and sizes
. Varying densities High-dimensional data (MinPts=4, Eps=9.")
40 When DBSCAN Does NOT Work Well Original Points (MinPts=4, Eps=9.75). Varying densities High-dimensional data (MinPts=4, Eps=9.92)
41 DBSCAN: Sensitive to Parameters
42 Other algorithms PAM, CLARANS: Solutions for the k-medoids problem BIRCH: Constructs a hierarchical tree that acts a summary of the data, and then clusters the leaves. MST: Clustering using the Minimum Spanning Tree. ROCK: clustering categorical data by neighbor and link analysis LIMBO, COOLCAT: Clustering categorical data using information theoretic tools. CURE: Hierarchical algorithm uses different representation of the cluster CHAMELEON: Hierarchical algorithm uses closeness and interconnectivity for merging
43 CLUSTERING VALIDITY
44 Cluster Validity How do we evaluate the goodness of the resulting clusters? But clusters are in the eye of the beholder! Then why do we want to evaluate them? To avoid finding patterns in noise To compare clustering algorithms To compare two sets of clusters To compare two clusters
45 y y y y Clusters found in Random Data Random Points x x DBSCAN K-means Complete Link x x
46 Different Aspects of Cluster Validation 1. Determining the clustering tendency of a set of data, i.e., distinguishing whether non-random structure actually exists in the data. 2. Comparing the results of a cluster analysis to externally known results, e.g., to externally given class labels. 3. Evaluating how well the results of a cluster analysis fit the data without reference to external information. - Use only the data 4. Comparing the results of two different sets of cluster analyses to determine which is better. 5. Determining the correct number of clusters. For 2, 3, and 4, we can further distinguish whether we want to evaluate the entire clustering or just individual clusters.
47 Measures of Cluster Validity Numerical measures that are applied to judge various aspects of cluster validity, are classified into the following three types. External Index: Used to measure the extent to which cluster labels match externally supplied class labels. Entropy Internal Index: Used to measure the goodness of a clustering structure without respect to external information. Sum of Squared Error (SSE) Relative Index: Used to compare two different clusterings or clusters. Often an external or internal index is used for this function, e.g., SSE or entropy Sometimes these are referred to as criteria instead of indices However, sometimes criterion is the general strategy and index is the numerical measure that implements the criterion.
48 Measuring Cluster Validity Via Correlation Two matrices Proximity Matrix Incidence Matrix One row and one column for each data point An entry is 1 if the associated pair of points belong to the same cluster An entry is 0 if the associated pair of points belongs to different clusters Compute the correlation between the two matrices Since the matrices are symmetric, only the correlation between n(n-1) / 2 entries needs to be calculated. High correlation indicates that points that belong to the same cluster are close to each other. Not a good measure for some density or contiguity based clusters.
49 y y Measuring Cluster Validity Via Correlation Correlation of incidence and proximity matrices for the K-means clusterings of the following two data sets x Corr = Corr = x
50 y Points Using Similarity Matrix for Cluster Validation Order the similarity matrix with respect to cluster labels and inspect visually x Points Similarity
51 Points y Using Similarity Matrix for Cluster Validation Clusters in random data are not so crisp Similarity 0 Points x DBSCAN
52 Points y Using Similarity Matrix for Cluster Validation Clusters in random data are not so crisp Similarity 0 Points x K-means
53 Points y Using Similarity Matrix for Cluster Validation Clusters in random data are not so crisp Points Similarity x Complete Link
54 Using Similarity Matrix for Cluster Validation DBSCAN
55 SSE Internal Measures: SSE Clusters in more complicated figures aren t well separated Internal Index: Used to measure the goodness of a clustering structure without respect to external information SSE SSE is good for comparing two clusterings or two clusters (average SSE). Can also be used to estimate the number of clusters K
56 Internal Measures: SSE SSE curve for a more complicated data set SSE of clusters found using K-means
57 Framework for Cluster Validity Need a framework to interpret any measure. For example, if our measure of evaluation has the value, 10, is that good, fair, or poor? Statistics provide a framework for cluster validity The more atypical a clustering result is, the more likely it represents valid structure in the data Can compare the values of an index that result from random data or clusterings to those of a clustering result. If the value of the index is unlikely, then the cluster results are valid These approaches are more complicated and harder to understand. For comparing the results of two different sets of cluster analyses, a framework is less necessary. However, there is the question of whether the difference between two index values is significant
58 y Count Statistical Framework for SSE Example Compare SSE of against three clusters in random data Histogram shows SSE of three clusters in 500 sets of random data points of size 100 distributed over the range for x and y values x SSE

59 y y Statistical Framework for Correlation Correlation of incidence and proximity matrices for the K-means clusterings of the following two data sets x x Corr = Corr =
60 Internal Measures: Cohesion and Separation Cluster Cohesion: Measures how closely related are objects in a cluster Example: SSE Cluster Separation: Measure how distinct or wellseparated a cluster is from other clusters Example: Squared Error Cohesion is measured by the within cluster sum of squares (SSE) 2 WSS ( x mi ) i x C i Separation is measured by the between cluster sum of squares 2 BSS Ci ( m m i ) i Where C i is the size of cluster i
61 Internal Measures: Cohesion and Separation A proximity graph based approach can also be used for cohesion and separation. Cluster cohesion is the sum of the weight of all links within a cluster. Cluster separation is the sum of the weights between nodes in the cluster and nodes outside the cluster. cohesion separation
62 External Measures for Clustering Validity Assume that the data is labeled with some class labels E.g., documents are classified into topics, people classified according to their income, senators classified as republican or democrat. In this case we want the clusters to be homogeneous with respect to classes Each cluster should contain elements of mostly one class Also each class should ideally be assigned to a single cluster This does not always make sense Clustering is not the same as classification But this is what people use most of the time
63 Measures m = number of points m i = points in cluster i m j = points in class j m ij = points in cluster i coming from class j p ij = m ij /m i = prob of element from class j in cluster i Entropy: Of a cluster i: e i = L j=1 p ij log p ij Highest when uniform, zero when single class Of a clustering: e = K i=1 Purity: Of a cluster i: p i = max p ij j Of a clustering: purity = m i m e i K i=1 m i m p i
64 Measures Precision: Of cluster i with respect to class j: Prec i, j = p ij Recall: Of cluster I with respect to class j: Rec i, j = m ij m j F-measure: Harmonic Mean of Precision and Recall: 2 Prec i, j Rec(i, j) F i, j = Prec i, j + Rec(i, j)
65 External Measures of Cluster Validity: Entropy and Purity
66 Final Comment on Cluster Validity The validation of clustering structures is the most difficult and frustrating part of cluster analysis. Without a strong effort in this direction, cluster analysis will remain a black art accessible only to those true believers who have experience and great courage. Algorithms for Clustering Data, Jain and Dubes
Other Test Constructions: Likelihood Ratio & Bayes Tests
 Other Test Constructions: Likelihood Ratio & Bayes Tests Side-Note: So far we have seen a few approaches for creating tests such as Neyman-Pearson Lemma ( most powerful tests of H 0 : θ = θ 0 vs H 1 :
ΚΥΠΡΙΑΚΗ ΕΤΑΙΡΕΙΑ ΠΛΗΡΟΦΟΡΙΚΗΣ CYPRUS COMPUTER SOCIETY ΠΑΓΚΥΠΡΙΟΣ ΜΑΘΗΤΙΚΟΣ ΔΙΑΓΩΝΙΣΜΟΣ ΠΛΗΡΟΦΟΡΙΚΗΣ 19/5/2007
 Οδηγίες: Να απαντηθούν όλες οι ερωτήσεις. Αν κάπου κάνετε κάποιες υποθέσεις να αναφερθούν στη σχετική ερώτηση. Όλα τα αρχεία που αναφέρονται στα προβλήματα βρίσκονται στον ίδιο φάκελο με το εκτελέσιμο
Math 6 SL Probability Distributions Practice Test Mark Scheme
 Math 6 SL Probability Distributions Practice Test Mark Scheme. (a) Note: Award A for vertical line to right of mean, A for shading to right of their vertical line. AA N (b) evidence of recognizing symmetry
Μηχανική Μάθηση Hypothesis Testing
 ΕΛΛΗΝΙΚΗ ΔΗΜΟΚΡΑΤΙΑ ΠΑΝΕΠΙΣΤΗΜΙΟ ΚΡΗΤΗΣ Μηχανική Μάθηση Hypothesis Testing Γιώργος Μπορμπουδάκης Τμήμα Επιστήμης Υπολογιστών Procedure 1. Form the null (H 0 ) and alternative (H 1 ) hypothesis 2. Consider
2 Composition. Invertible Mappings
 Arkansas Tech University MATH 4033: Elementary Modern Algebra Dr. Marcel B. Finan Composition. Invertible Mappings In this section we discuss two procedures for creating new mappings from old ones, namely,
The Simply Typed Lambda Calculus
 Type Inference Instead of writing type annotations, can we use an algorithm to infer what the type annotations should be? That depends on the type system. For simple type systems the answer is yes, and
ΕΙΣΑΓΩΓΗ ΣΤΗ ΣΤΑΤΙΣΤΙΚΗ ΑΝΑΛΥΣΗ
 ΕΙΣΑΓΩΓΗ ΣΤΗ ΣΤΑΤΙΣΤΙΚΗ ΑΝΑΛΥΣΗ ΕΛΕΝΑ ΦΛΟΚΑ Επίκουρος Καθηγήτρια Τµήµα Φυσικής, Τοµέας Φυσικής Περιβάλλοντος- Μετεωρολογίας ΓΕΝΙΚΟΙ ΟΡΙΣΜΟΙ Πληθυσµός Σύνολο ατόµων ή αντικειµένων στα οποία αναφέρονται
5.4 The Poisson Distribution.
 The worst thing you can do about a situation is nothing. Sr. O Shea Jackson 5.4 The Poisson Distribution. Description of the Poisson Distribution Discrete probability distribution. The random variable
ST5224: Advanced Statistical Theory II
 ST5224: Advanced Statistical Theory II 2014/2015: Semester II Tutorial 7 1. Let X be a sample from a population P and consider testing hypotheses H 0 : P = P 0 versus H 1 : P = P 1, where P j is a known
Bayesian statistics. DS GA 1002 Probability and Statistics for Data Science.
 Bayesian statistics DS GA 1002 Probability and Statistics for Data Science http://www.cims.nyu.edu/~cfgranda/pages/dsga1002_fall17 Carlos Fernandez-Granda Frequentist vs Bayesian statistics In frequentist
EE512: Error Control Coding
 EE512: Error Control Coding Solution for Assignment on Finite Fields February 16, 2007 1. (a) Addition and Multiplication tables for GF (5) and GF (7) are shown in Tables 1 and 2. + 0 1 2 3 4 0 0 1 2 3
Approximation of distance between locations on earth given by latitude and longitude
 Approximation of distance between locations on earth given by latitude and longitude Jan Behrens 2012-12-31 In this paper we shall provide a method to approximate distances between two points on earth
HISTOGRAMS AND PERCENTILES What is the 25 th percentile of a histogram? What is the 50 th percentile for the cigarette histogram?
 HISTOGRAMS AND PERCENTILES What is the 25 th percentile of a histogram? The point on the horizontal axis such that of the area under the histogram lies to the left of that point (and to the right) What
6.3 Forecasting ARMA processes
 122 CHAPTER 6. ARMA MODELS 6.3 Forecasting ARMA processes The purpose of forecasting is to predict future values of a TS based on the data collected to the present. In this section we will discuss a linear
HOMEWORK 4 = G. In order to plot the stress versus the stretch we define a normalized stretch:
 HOMEWORK 4 Problem a For the fast loading case, we want to derive the relationship between P zz and λ z. We know that the nominal stress is expressed as: P zz = ψ λ z where λ z = λ λ z. Therefore, applying
Fractional Colorings and Zykov Products of graphs
 Fractional Colorings and Zykov Products of graphs Who? Nichole Schimanski When? July 27, 2011 Graphs A graph, G, consists of a vertex set, V (G), and an edge set, E(G). V (G) is any finite set E(G) is
ΚΥΠΡΙΑΚΗ ΕΤΑΙΡΕΙΑ ΠΛΗΡΟΦΟΡΙΚΗΣ CYPRUS COMPUTER SOCIETY ΠΑΓΚΥΠΡΙΟΣ ΜΑΘΗΤΙΚΟΣ ΔΙΑΓΩΝΙΣΜΟΣ ΠΛΗΡΟΦΟΡΙΚΗΣ 24/3/2007
 Οδηγίες: Να απαντηθούν όλες οι ερωτήσεις. Όλοι οι αριθμοί που αναφέρονται σε όλα τα ερωτήματα μικρότεροι του 10000 εκτός αν ορίζεται διαφορετικά στη διατύπωση του προβλήματος. Αν κάπου κάνετε κάποιες υποθέσεις
HW 3 Solutions 1. a) I use the auto.arima R function to search over models using AIC and decide on an ARMA(3,1)
 I use the auto.arima R function to search over models using AIC and decide on an ARMA(3,1)") HW 3 Solutions a) I use the autoarima R function to search over models using AIC and decide on an ARMA3,) b) I compare the ARMA3,) to ARMA,0) ARMA3,) does better in all three criteria c) The plot of the
HW 3 Solutions a) I use the autoarima R function to search over models using AIC and decide on an ARMA3,) b) I compare the ARMA3,) to ARMA,0) ARMA3,) does better in all three criteria c) The plot of the
Section 9.2 Polar Equations and Graphs
 180 Section 9. Polar Equations and Graphs In this section, we will be graphing polar equations on a polar grid. In the first few examples, we will write the polar equation in rectangular form to help identify
Section 8.3 Trigonometric Equations
 99 Section 8. Trigonometric Equations Objective 1: Solve Equations Involving One Trigonometric Function. In this section and the next, we will exple how to solving equations involving trigonometric functions.
ΚΥΠΡΙΑΚΗ ΕΤΑΙΡΕΙΑ ΠΛΗΡΟΦΟΡΙΚΗΣ CYPRUS COMPUTER SOCIETY ΠΑΓΚΥΠΡΙΟΣ ΜΑΘΗΤΙΚΟΣ ΔΙΑΓΩΝΙΣΜΟΣ ΠΛΗΡΟΦΟΡΙΚΗΣ 6/5/2006
 Οδηγίες: Να απαντηθούν όλες οι ερωτήσεις. Ολοι οι αριθμοί που αναφέρονται σε όλα τα ερωτήματα είναι μικρότεροι το 1000 εκτός αν ορίζεται διαφορετικά στη διατύπωση του προβλήματος. Διάρκεια: 3,5 ώρες Καλή
Statistical Inference I Locally most powerful tests
 Statistical Inference I Locally most powerful tests Shirsendu Mukherjee Department of Statistics, Asutosh College, Kolkata, India. shirsendu st@yahoo.co.in So far we have treated the testing of one-sided
Econ 2110: Fall 2008 Suggested Solutions to Problem Set 8 questions or comments to Dan Fetter 1
 Eon : Fall 8 Suggested Solutions to Problem Set 8 Email questions or omments to Dan Fetter Problem. Let X be a salar with density f(x, θ) (θx + θ) [ x ] with θ. (a) Find the most powerful level α test
Strain gauge and rosettes
 Strain gauge and rosettes Introduction A strain gauge is a device which is used to measure strain (deformation) on an object subjected to forces. Strain can be measured using various types of devices classified
EPL 603 TOPICS IN SOFTWARE ENGINEERING. Lab 5: Component Adaptation Environment (COPE)
") EPL 603 TOPICS IN SOFTWARE ENGINEERING Lab 5: Component Adaptation Environment (COPE) Performing Static Analysis 1 Class Name: The fully qualified name of the specific class Type: The type of the class
EPL 603 TOPICS IN SOFTWARE ENGINEERING Lab 5: Component Adaptation Environment (COPE) Performing Static Analysis 1 Class Name: The fully qualified name of the specific class Type: The type of the class
Problem Set 3: Solutions
 CMPSCI 69GG Applied Information Theory Fall 006 Problem Set 3: Solutions. [Cover and Thomas 7.] a Define the following notation, C I p xx; Y max X; Y C I p xx; Ỹ max I X; Ỹ We would like to show that C
Solutions to Exercise Sheet 5
 Solutions to Eercise Sheet 5 jacques@ucsd.edu. Let X and Y be random variables with joint pdf f(, y) = 3y( + y) where and y. Determine each of the following probabilities. Solutions. a. P (X ). b. P (X
4.6 Autoregressive Moving Average Model ARMA(1,1)
") 84 CHAPTER 4. STATIONARY TS MODELS 4.6 Autoregressive Moving Average Model ARMA(,) This section is an introduction to a wide class of models ARMA(p,q) which we will consider in more detail later in this
84 CHAPTER 4. STATIONARY TS MODELS 4.6 Autoregressive Moving Average Model ARMA(,) This section is an introduction to a wide class of models ARMA(p,q) which we will consider in more detail later in this
Solution Series 9. i=1 x i and i=1 x i.
 Lecturer: Prof. Dr. Mete SONER Coordinator: Yilin WANG Solution Series 9 Q1. Let α, β >, the p.d.f. of a beta distribution with parameters α and β is { Γ(α+β) Γ(α)Γ(β) f(x α, β) xα 1 (1 x) β 1 for < x
The challenges of non-stable predicates
 The challenges of non-stable predicates Consider a non-stable predicate Φ encoding, say, a safety property. We want to determine whether Φ holds for our program. The challenges of non-stable predicates
3.4 SUM AND DIFFERENCE FORMULAS. NOTE: cos(α+β) cos α + cos β cos(α-β) cos α -cos β
 cos α + cos β cos(α-β) cos α -cos β") 3.4 SUM AND DIFFERENCE FORMULAS Page Theorem cos(αβ cos α cos β -sin α cos(α-β cos α cos β sin α NOTE: cos(αβ cos α cos β cos(α-β cos α -cos β Proof of cos(α-β cos α cos β sin α Let s use a unit circle
3.4 SUM AND DIFFERENCE FORMULAS Page Theorem cos(αβ cos α cos β -sin α cos(α-β cos α cos β sin α NOTE: cos(αβ cos α cos β cos(α-β cos α -cos β Proof of cos(α-β cos α cos β sin α Let s use a unit circle
Queensland University of Technology Transport Data Analysis and Modeling Methodologies
 Queensland University of Technology Transport Data Analysis and Modeling Methodologies Lab Session #7 Example 5.2 (with 3SLS Extensions) Seemingly Unrelated Regression Estimation and 3SLS A survey of 206
Estimation for ARMA Processes with Stable Noise. Matt Calder & Richard A. Davis Colorado State University
 Estimation for ARMA Processes with Stable Noise Matt Calder & Richard A. Davis Colorado State University rdavis@stat.colostate.edu 1 ARMA processes with stable noise Review of M-estimation Examples of
ΚΥΠΡΙΑΚΟΣ ΣΥΝΔΕΣΜΟΣ ΠΛΗΡΟΦΟΡΙΚΗΣ CYPRUS COMPUTER SOCIETY 21 ος ΠΑΓΚΥΠΡΙΟΣ ΜΑΘΗΤΙΚΟΣ ΔΙΑΓΩΝΙΣΜΟΣ ΠΛΗΡΟΦΟΡΙΚΗΣ Δεύτερος Γύρος - 30 Μαρτίου 2011
 Διάρκεια Διαγωνισμού: 3 ώρες Απαντήστε όλες τις ερωτήσεις Μέγιστο Βάρος (20 Μονάδες) Δίνεται ένα σύνολο από N σφαιρίδια τα οποία δεν έχουν όλα το ίδιο βάρος μεταξύ τους και ένα κουτί που αντέχει μέχρι
Lecture 2. Soundness and completeness of propositional logic
 Lecture 2 Soundness and completeness of propositional logic February 9, 2004 1 Overview Review of natural deduction. Soundness and completeness. Semantics of propositional formulas. Soundness proof. Completeness
Instruction Execution Times
 1 C Execution Times InThisAppendix... Introduction DL330 Execution Times DL330P Execution Times DL340 Execution Times C-2 Execution Times Introduction Data Registers This appendix contains several tables
Numerical Analysis FMN011
 Numerical Analysis FMN011 Carmen Arévalo Lund University carmen@maths.lth.se Lecture 12 Periodic data A function g has period P if g(x + P ) = g(x) Model: Trigonometric polynomial of order M T M (x) =
Reminders: linear functions
 Reminders: linear functions Let U and V be vector spaces over the same field F. Definition A function f : U V is linear if for every u 1, u 2 U, f (u 1 + u 2 ) = f (u 1 ) + f (u 2 ), and for every u U
Partial Differential Equations in Biology The boundary element method. March 26, 2013
 The boundary element method March 26, 203 Introduction and notation The problem: u = f in D R d u = ϕ in Γ D u n = g on Γ N, where D = Γ D Γ N, Γ D Γ N = (possibly, Γ D = [Neumann problem] or Γ N = [Dirichlet
Homework 3 Solutions
 Homework 3 Solutions Igor Yanovsky (Math 151A TA) Problem 1: Compute the absolute error and relative error in approximations of p by p. (Use calculator!) a) p π, p 22/7; b) p π, p 3.141. Solution: For
Congruence Classes of Invertible Matrices of Order 3 over F 2
 International Journal of Algebra, Vol. 8, 24, no. 5, 239-246 HIKARI Ltd, www.m-hikari.com http://dx.doi.org/.2988/ija.24.422 Congruence Classes of Invertible Matrices of Order 3 over F 2 Ligong An and
Démographie spatiale/spatial Demography
 ΠΑΝΕΠΙΣΤΗΜΙΟ ΘΕΣΣΑΛΙΑΣ Démographie spatiale/spatial Demography Session 1: Introduction to spatial demography Basic concepts Michail Agorastakis Department of Planning & Regional Development Άδειες Χρήσης
Aquinas College. Edexcel Mathematical formulae and statistics tables DO NOT WRITE ON THIS BOOKLET
 Aquinas College Edexcel Mathematical formulae and statistics tables DO NOT WRITE ON THIS BOOKLET Pearson Edexcel Level 3 Advanced Subsidiary and Advanced GCE in Mathematics and Further Mathematics Mathematical
ΕΛΛΗΝΙΚΗ ΔΗΜΟΚΡΑΤΙΑ ΠΑΝΕΠΙΣΤΗΜΙΟ ΚΡΗΤΗΣ. Ψηφιακή Οικονομία. Διάλεξη 7η: Consumer Behavior Mαρίνα Μπιτσάκη Τμήμα Επιστήμης Υπολογιστών
 ΕΛΛΗΝΙΚΗ ΔΗΜΟΚΡΑΤΙΑ ΠΑΝΕΠΙΣΤΗΜΙΟ ΚΡΗΤΗΣ Ψηφιακή Οικονομία Διάλεξη 7η: Consumer Behavior Mαρίνα Μπιτσάκη Τμήμα Επιστήμης Υπολογιστών Τέλος Ενότητας Χρηματοδότηση Το παρόν εκπαιδευτικό υλικό έχει αναπτυχθεί
Physical DB Design. B-Trees Index files can become quite large for large main files Indices on index files are possible.
 B-Trees Index files can become quite large for large main files Indices on index files are possible 3 rd -level index 2 nd -level index 1 st -level index Main file 1 The 1 st -level index consists of pairs
Block Ciphers Modes. Ramki Thurimella
 Block Ciphers Modes Ramki Thurimella Only Encryption I.e. messages could be modified Should not assume that nonsensical messages do no harm Always must be combined with authentication 2 Padding Must be
derivation of the Laplacian from rectangular to spherical coordinates
 derivation of the Laplacian from rectangular to spherical coordinates swapnizzle 03-03- :5:43 We begin by recognizing the familiar conversion from rectangular to spherical coordinates (note that φ is used
CHAPTER 25 SOLVING EQUATIONS BY ITERATIVE METHODS
 CHAPTER 5 SOLVING EQUATIONS BY ITERATIVE METHODS EXERCISE 104 Page 8 1. Find the positive root of the equation x + 3x 5 = 0, correct to 3 significant figures, using the method of bisection. Let f(x) =
the total number of electrons passing through the lamp.
 1. A 12 V 36 W lamp is lit to normal brightness using a 12 V car battery of negligible internal resistance. The lamp is switched on for one hour (3600 s). For the time of 1 hour, calculate (i) the energy
Probability and Random Processes (Part II)
") Probability and Random Processes (Part II) 1. If the variance σ x of d(n) = x(n) x(n 1) is one-tenth the variance σ x of a stationary zero-mean discrete-time signal x(n), then the normalized autocorrelation
Probability and Random Processes (Part II) 1. If the variance σ x of d(n) = x(n) x(n 1) is one-tenth the variance σ x of a stationary zero-mean discrete-time signal x(n), then the normalized autocorrelation
Phys460.nb Solution for the t-dependent Schrodinger s equation How did we find the solution? (not required)
") Phys460.nb 81 ψ n (t) is still the (same) eigenstate of H But for tdependent H. The answer is NO. 5.5.5. Solution for the tdependent Schrodinger s equation If we assume that at time t 0, the electron starts
Phys460.nb 81 ψ n (t) is still the (same) eigenstate of H But for tdependent H. The answer is NO. 5.5.5. Solution for the tdependent Schrodinger s equation If we assume that at time t 0, the electron starts
C.S. 430 Assignment 6, Sample Solutions
 C.S. 430 Assignment 6, Sample Solutions Paul Liu November 15, 2007 Note that these are sample solutions only; in many cases there were many acceptable answers. 1 Reynolds Problem 10.1 1.1 Normal-order
Πρόβλημα 1: Αναζήτηση Ελάχιστης/Μέγιστης Τιμής
 Πρόβλημα 1: Αναζήτηση Ελάχιστης/Μέγιστης Τιμής Να γραφεί πρόγραμμα το οποίο δέχεται ως είσοδο μια ακολουθία S από n (n 40) ακέραιους αριθμούς και επιστρέφει ως έξοδο δύο ακολουθίες από θετικούς ακέραιους
TMA4115 Matematikk 3
 TMA4115 Matematikk 3 Andrew Stacey Norges Teknisk-Naturvitenskapelige Universitet Trondheim Spring 2010 Lecture 12: Mathematics Marvellous Matrices Andrew Stacey Norges Teknisk-Naturvitenskapelige Universitet
ΠΑΝΕΠΙΣΤΗΜΙΟ ΚΥΠΡΟΥ - ΤΜΗΜΑ ΠΛΗΡΟΦΟΡΙΚΗΣ ΕΠΛ 133: ΑΝΤΙΚΕΙΜΕΝΟΣΤΡΕΦΗΣ ΠΡΟΓΡΑΜΜΑΤΙΣΜΟΣ ΕΡΓΑΣΤΗΡΙΟ 3 Javadoc Tutorial
 ΕΡΓΑΣΤΗΡΙΟ 3 Javadoc Tutorial Introduction Το Javadoc είναι ένα εργαλείο που παράγει αρχεία html (παρόμοιο με τις σελίδες στη διεύθυνση http://docs.oracle.com/javase/8/docs/api/index.html) από τα σχόλια
New bounds for spherical two-distance sets and equiangular lines
 New bounds for spherical two-distance sets and equiangular lines Michigan State University Oct 8-31, 016 Anhui University Definition If X = {x 1, x,, x N } S n 1 (unit sphere in R n ) and x i, x j = a
9.09. # 1. Area inside the oval limaçon r = cos θ. To graph, start with θ = 0 so r = 6. Compute dr
 9.9 #. Area inside the oval limaçon r = + cos. To graph, start with = so r =. Compute d = sin. Interesting points are where d vanishes, or at =,,, etc. For these values of we compute r:,,, and the values
PARTIAL NOTES for 6.1 Trigonometric Identities
 PARTIAL NOTES for 6.1 Trigonometric Identities tanθ = sinθ cosθ cotθ = cosθ sinθ BASIC IDENTITIES cscθ = 1 sinθ secθ = 1 cosθ cotθ = 1 tanθ PYTHAGOREAN IDENTITIES sin θ + cos θ =1 tan θ +1= sec θ 1 + cot
CE 530 Molecular Simulation
 C 53 olecular Siulation Lecture Histogra Reweighting ethods David. Kofke Departent of Cheical ngineering SUNY uffalo kofke@eng.buffalo.edu Histogra Reweighting ethod to cobine results taken at different
Every set of first-order formulas is equivalent to an independent set
 Every set of first-order formulas is equivalent to an independent set May 6, 2008 Abstract A set of first-order formulas, whatever the cardinality of the set of symbols, is equivalent to an independent
Example of the Baum-Welch Algorithm
 Example of the Baum-Welch Algorithm Larry Moss Q520, Spring 2008 1 Our corpus c We start with a very simple corpus. We take the set Y of unanalyzed words to be {ABBA, BAB}, and c to be given by c(abba)
Review Test 3. MULTIPLE CHOICE. Choose the one alternative that best completes the statement or answers the question.
 Review Test MULTIPLE CHOICE. Choose the one alternative that best completes the statement or answers the question. Find the exact value of the expression. 1) sin - 11π 1 1) + - + - - ) sin 11π 1 ) ( -
Math221: HW# 1 solutions
 Math: HW# solutions Andy Royston October, 5 7.5.7, 3 rd Ed. We have a n = b n = a = fxdx = xdx =, x cos nxdx = x sin nx n sin nxdx n = cos nx n = n n, x sin nxdx = x cos nx n + cos nxdx n cos n = + sin
Models for Probabilistic Programs with an Adversary
 Models for Probabilistic Programs with an Adversary Robert Rand, Steve Zdancewic University of Pennsylvania Probabilistic Programming Semantics 2016 Interactive Proofs 2/47 Interactive Proofs 2/47 Interactive
6. MAXIMUM LIKELIHOOD ESTIMATION
 6 MAXIMUM LIKELIHOOD ESIMAION [1] Maximum Likelihood Estimator (1) Cases in which θ (unknown parameter) is scalar Notational Clarification: From now on, we denote the true value of θ as θ o hen, view θ
SUPERPOSITION, MEASUREMENT, NORMALIZATION, EXPECTATION VALUES. Reading: QM course packet Ch 5 up to 5.6
 SUPERPOSITION, MEASUREMENT, NORMALIZATION, EXPECTATION VALUES Readig: QM course packet Ch 5 up to 5. 1 ϕ (x) = E = π m( a) =1,,3,4,5 for xa (x) = πx si L L * = πx L si L.5 ϕ' -.5 z 1 (x) = L si
Statistics 104: Quantitative Methods for Economics Formula and Theorem Review
 Harvard College Statistics 104: Quantitative Methods for Economics Formula and Theorem Review Tommy MacWilliam, 13 tmacwilliam@college.harvard.edu March 10, 2011 Contents 1 Introduction to Data 5 1.1 Sample
Jesse Maassen and Mark Lundstrom Purdue University November 25, 2013
 Notes on Average Scattering imes and Hall Factors Jesse Maassen and Mar Lundstrom Purdue University November 5, 13 I. Introduction 1 II. Solution of the BE 1 III. Exercises: Woring out average scattering
Areas and Lengths in Polar Coordinates
 Kiryl Tsishchanka Areas and Lengths in Polar Coordinates In this section we develop the formula for the area of a region whose boundary is given by a polar equation. We need to use the formula for the
CHAPTER 101 FOURIER SERIES FOR PERIODIC FUNCTIONS OF PERIOD
 CHAPTER FOURIER SERIES FOR PERIODIC FUNCTIONS OF PERIOD EXERCISE 36 Page 66. Determine the Fourier series for the periodic function: f(x), when x +, when x which is periodic outside this rge of period.
ANSWERSHEET (TOPIC = DIFFERENTIAL CALCULUS) COLLECTION #2. h 0 h h 0 h h 0 ( ) g k = g 0 + g 1 + g g 2009 =?
 COLLECTION #2. h 0 h h 0 h h 0 ( ) g k = g 0 + g 1 + g g 2009 =?") Teko Classes IITJEE/AIEEE Maths by SUHAAG SIR, Bhopal, Ph (0755) 3 00 000 www.tekoclasses.com ANSWERSHEET (TOPIC DIFFERENTIAL CALCULUS) COLLECTION # Question Type A.Single Correct Type Q. (A) Sol least
Teko Classes IITJEE/AIEEE Maths by SUHAAG SIR, Bhopal, Ph (0755) 3 00 000 www.tekoclasses.com ANSWERSHEET (TOPIC DIFFERENTIAL CALCULUS) COLLECTION # Question Type A.Single Correct Type Q. (A) Sol least
department listing department name αχχουντσ ϕανε βαλικτ δδσϕηασδδη σδηφγ ασκϕηλκ τεχηνιχαλ αλαν ϕουν διξ τεχηνιχαλ ϕοην µαριανι
 She selects the option. Jenny starts with the al listing. This has employees listed within She drills down through the employee. The inferred ER sttricture relates this to the redcords in the databasee
[1] P Q. Fig. 3.1
![[1] P Q. Fig. 3.1](/thumbs/79/80362156.jpg "[1] P Q. Fig. 3.1") 1 (a) Define resistance....... [1] (b) The smallest conductor within a computer processing chip can be represented as a rectangular block that is one atom high, four atoms wide and twenty atoms long. One
1 (a) Define resistance....... [1] (b) The smallest conductor within a computer processing chip can be represented as a rectangular block that is one atom high, four atoms wide and twenty atoms long. One
CHAPTER 48 APPLICATIONS OF MATRICES AND DETERMINANTS
 CHAPTER 48 APPLICATIONS OF MATRICES AND DETERMINANTS EXERCISE 01 Page 545 1. Use matrices to solve: 3x + 4y x + 5y + 7 3x + 4y x + 5y 7 Hence, 3 4 x 0 5 y 7 The inverse of 3 4 5 is: 1 5 4 1 5 4 15 8 3
Section 7.6 Double and Half Angle Formulas
 09 Section 7. Double and Half Angle Fmulas To derive the double-angles fmulas, we will use the sum of two angles fmulas that we developed in the last section. We will let α θ and β θ: cos(θ) cos(θ + θ)
SCHOOL OF MATHEMATICAL SCIENCES G11LMA Linear Mathematics Examination Solutions
 SCHOOL OF MATHEMATICAL SCIENCES GLMA Linear Mathematics 00- Examination Solutions. (a) i. ( + 5i)( i) = (6 + 5) + (5 )i = + i. Real part is, imaginary part is. (b) ii. + 5i i ( + 5i)( + i) = ( i)( + i)
Αποθήκες Δεδομένων και Εξόρυξη Δεδομένων:
 Αποθήκες Δεδομένων και Εξόρυξη Δεδομένων: Oμαδοποίηση: Μέρος Δ http://delab.csd.auth.gr/~gounaris/courses/dwdm/ gounaris/courses/dwdm/ Ευχαριστίες Οι διαφάνειες του μαθήματος σε γενικές γραμμές ακολουθούν
Lecture 2: Dirac notation and a review of linear algebra Read Sakurai chapter 1, Baym chatper 3
 Lecture 2: Dirac notation and a review of linear algebra Read Sakurai chapter 1, Baym chatper 3 1 State vector space and the dual space Space of wavefunctions The space of wavefunctions is the set of all
SOLUTIONS TO MATH38181 EXTREME VALUES AND FINANCIAL RISK EXAM
 SOLUTIONS TO MATH38181 EXTREME VALUES AND FINANCIAL RISK EXAM Solutions to Question 1 a) The cumulative distribution function of T conditional on N n is Pr T t N n) Pr max X 1,..., X N ) t N n) Pr max
ΑΝΑΚΕΦΑΛΑΙΩΣΗ. Τα βασικά για την γλώσσα Java
 JAVA, NETBEANS ΑΝΑΚΕΦΑΛΑΙΩΣΗ Τα βασικά για την γλώσσα Java Java portability Το μεγαλύτερο πλεονέκτημα της Java είναι η μεταφερσιμότητα: ο κώδικας μπορεί να τρέξει πάνω σε οποιαδήποτε πλατφόρμα. Write-Once-Run-Anywhere
Srednicki Chapter 55
 Srednicki Chapter 55 QFT Problems & Solutions A. George August 3, 03 Srednicki 55.. Use equations 55.3-55.0 and A i, A j ] = Π i, Π j ] = 0 (at equal times) to verify equations 55.-55.3. This is our third
6.1. Dirac Equation. Hamiltonian. Dirac Eq.
 6.1. Dirac Equation Ref: M.Kaku, Quantum Field Theory, Oxford Univ Press (1993) η μν = η μν = diag(1, -1, -1, -1) p 0 = p 0 p = p i = -p i p μ p μ = p 0 p 0 + p i p i = E c 2 - p 2 = (m c) 2 H = c p 2
Matrices and Determinants
 Matrices and Determinants SUBJECTIVE PROBLEMS: Q 1. For what value of k do the following system of equations possess a non-trivial (i.e., not all zero) solution over the set of rationals Q? x + ky + 3z
ΕΛΛΗΝΙΚΗ ΔΗΜΟΚΡΑΤΙΑ ΠΑΝΕΠΙΣΤΗΜΙΟ ΚΡΗΤΗΣ. Ψηφιακή Οικονομία. Διάλεξη 10η: Basics of Game Theory part 2 Mαρίνα Μπιτσάκη Τμήμα Επιστήμης Υπολογιστών
 ΕΛΛΗΝΙΚΗ ΔΗΜΟΚΡΑΤΙΑ ΠΑΝΕΠΙΣΤΗΜΙΟ ΚΡΗΤΗΣ Ψηφιακή Οικονομία Διάλεξη 0η: Basics of Game Theory part 2 Mαρίνα Μπιτσάκη Τμήμα Επιστήμης Υπολογιστών Best Response Curves Used to solve for equilibria in games
FORMULAS FOR STATISTICS 1
 FORMULAS FOR STATISTICS 1 X = 1 n Sample statistics X i or x = 1 n x i (sample mean) S 2 = 1 n 1 s 2 = 1 n 1 (X i X) 2 = 1 n 1 (x i x) 2 = 1 n 1 Xi 2 n n 1 X 2 x 2 i n n 1 x 2 or (sample variance) E(X)
Areas and Lengths in Polar Coordinates
 Kiryl Tsishchanka Areas and Lengths in Polar Coordinates In this section we develop the formula for the area of a region whose boundary is given by a polar equation. We need to use the formula for the
b. Use the parametrization from (a) to compute the area of S a as S a ds. Be sure to substitute for ds!
 to compute the area of S a as S a ds. Be sure to substitute for ds!") MTH U341 urface Integrals, tokes theorem, the divergence theorem To be turned in Wed., Dec. 1. 1. Let be the sphere of radius a, x 2 + y 2 + z 2 a 2. a. Use spherical coordinates (with ρ a) to parametrize.
MTH U341 urface Integrals, tokes theorem, the divergence theorem To be turned in Wed., Dec. 1. 1. Let be the sphere of radius a, x 2 + y 2 + z 2 a 2. a. Use spherical coordinates (with ρ a) to parametrize.
: Monte Carlo EM 313, Louis (1982) EM, EM Newton-Raphson, /. EM, 2 Monte Carlo EM Newton-Raphson, Monte Carlo EM, Monte Carlo EM, /. 3, Monte Carlo EM
 EM, EM Newton-Raphson, /. EM, 2 Monte Carlo EM Newton-Raphson, Monte Carlo EM, Monte Carlo EM, /. 3, Monte Carlo EM") 2008 6 Chinese Journal of Applied Probability and Statistics Vol.24 No.3 Jun. 2008 Monte Carlo EM 1,2 ( 1,, 200241; 2,, 310018) EM, E,,. Monte Carlo EM, EM E Monte Carlo,. EM, Monte Carlo EM,,,,. Newton-Raphson.
2008 6 Chinese Journal of Applied Probability and Statistics Vol.24 No.3 Jun. 2008 Monte Carlo EM 1,2 ( 1,, 200241; 2,, 310018) EM, E,,. Monte Carlo EM, EM E Monte Carlo,. EM, Monte Carlo EM,,,,. Newton-Raphson.
ΚΥΠΡΙΑΚΗ ΕΤΑΙΡΕΙΑ ΠΛΗΡΟΦΟΡΙΚΗΣ CYPRUS COMPUTER SOCIETY ΠΑΓΚΥΠΡΙΟΣ ΜΑΘΗΤΙΚΟΣ ΔΙΑΓΩΝΙΣΜΟΣ ΠΛΗΡΟΦΟΡΙΚΗΣ 11/3/2006
 ΠΑΓΚΥΠΡΙΟΣ ΜΑΘΗΤΙΚΟΣ ΔΙΑΓΩΝΙΣΜΟΣ ΠΛΗΡΟΦΟΡΙΚΗΣ 11/3/26 Οδηγίες: Να απαντηθούν όλες οι ερωτήσεις. Ολοι οι αριθμοί που αναφέρονται σε όλα τα ερωτήματα μικρότεροι το 1 εκτός αν ορίζεται διαφορετικά στη διατύπωση
Example Sheet 3 Solutions
 Example Sheet 3 Solutions. i Regular Sturm-Liouville. ii Singular Sturm-Liouville mixed boundary conditions. iii Not Sturm-Liouville ODE is not in Sturm-Liouville form. iv Regular Sturm-Liouville note
Chapter 6: Systems of Linear Differential. be continuous functions on the interval
 Chapter 6: Systems of Linear Differential Equations Let a (t), a 2 (t),..., a nn (t), b (t), b 2 (t),..., b n (t) be continuous functions on the interval I. The system of n first-order differential equations
χ 2 test ανεξαρτησίας
 χ 2 test ανεξαρτησίας Καθηγητής Ι. Κ. ΔΗΜΗΤΡΙΟΥ demetri@econ.uoa.gr 7.2 Το χ 2 Τεστ Ανεξαρτησίας Tο χ 2 τεστ ανεξαρτησίας (όπως και η παλινδρόμηση) είναι στατιστικά εργαλεία για τον εντοπισμό σχέσεων μεταξύ
Statistics & Research methods. Athanasios Papaioannou University of Thessaly Dept. of PE & Sport Science
 Statistics & Research methods Athanasios Papaioannou University of Thessaly Dept. of PE & Sport Science 30 25 1,65 20 1,66 15 10 5 1,67 1,68 Κανονική 0 Height 1,69 Καμπύλη Κανονική Διακύμανση & Ζ-scores
Correction Table for an Alcoholometer Calibrated at 20 o C
 An alcoholometer is a device that measures the concentration of ethanol in a water-ethanol mixture (often in units of %abv percent alcohol by volume). The depth to which an alcoholometer sinks in a water-ethanol
Προσομοίωση BP με το Bizagi Modeler
 Προσομοίωση BP με το Bizagi Modeler Α. Τσαλγατίδου - Γ.-Δ. Κάπος Πρόγραμμα Μεταπτυχιακών Σπουδών Τεχνολογία Διοίκησης Επιχειρησιακών Διαδικασιών 2017-2018 BPMN Simulation with Bizagi Modeler: 4 Levels
Practice Exam 2. Conceptual Questions. 1. State a Basic identity and then verify it. (a) Identity: Solution: One identity is csc(θ) = 1
 Identity: Solution: One identity is csc(θ) = 1") Conceptual Questions. State a Basic identity and then verify it. a) Identity: Solution: One identity is cscθ) = sinθ) Practice Exam b) Verification: Solution: Given the point of intersection x, y) of the
Conceptual Questions. State a Basic identity and then verify it. a) Identity: Solution: One identity is cscθ) = sinθ) Practice Exam b) Verification: Solution: Given the point of intersection x, y) of the
Mean bond enthalpy Standard enthalpy of formation Bond N H N N N N H O O O
 Q1. (a) Explain the meaning of the terms mean bond enthalpy and standard enthalpy of formation. Mean bond enthalpy... Standard enthalpy of formation... (5) (b) Some mean bond enthalpies are given below.
Second Order Partial Differential Equations
 Chapter 7 Second Order Partial Differential Equations 7.1 Introduction A second order linear PDE in two independent variables (x, y Ω can be written as A(x, y u x + B(x, y u xy + C(x, y u u u + D(x, y
( ) 2 and compare to M.
 2 and compare to M.") Problems and Solutions for Section 4.2 4.9 through 4.33) 4.9 Calculate the square root of the matrix 3!0 M!0 8 Hint: Let M / 2 a!b ; calculate M / 2!b c ) 2 and compare to M. Solution: Given: 3!0 M!0 8
Problems and Solutions for Section 4.2 4.9 through 4.33) 4.9 Calculate the square root of the matrix 3!0 M!0 8 Hint: Let M / 2 a!b ; calculate M / 2!b c ) 2 and compare to M. Solution: Given: 3!0 M!0 8